Forecasting COVID-19 Transmission Across Time in U.S. Counties
Statement of Problem
As the nation responded to the generational challenge of the COVID-19 pandemic, forecasting viral transmission across local communities became an important tool for planning and response. In the initial phase of the pandemic, this information was critical to help local, state and federal leadership make informed decisions about public policy solutions to manage the crisis.
Following the first wave of the pandemic in March 2020, there was a need to expand on robust and reliable data models that were increasingly relevant to local communities to inform their safe reopening. Together with reviewing emerging data on school and community safety, these data also helped communities navigate decision-making regarding returning more children to in-school instruction.
With available vaccines and regional variability in community transmission rates, COVID-19 is now transitioning toward an endemic virus with seasonal peaks in transmission; even so, we would anticipate additional periods of resurgence ahead, and it will be crucial to provide scientific evidence to support speedy and accurate responses.
Description
COVID-Lab: Forecasting COVID-19 Transmission Across Time in U.S. Counties
COVID-Lab: Forecasting COVID-19 Transmission Across Time in U.S. Counties


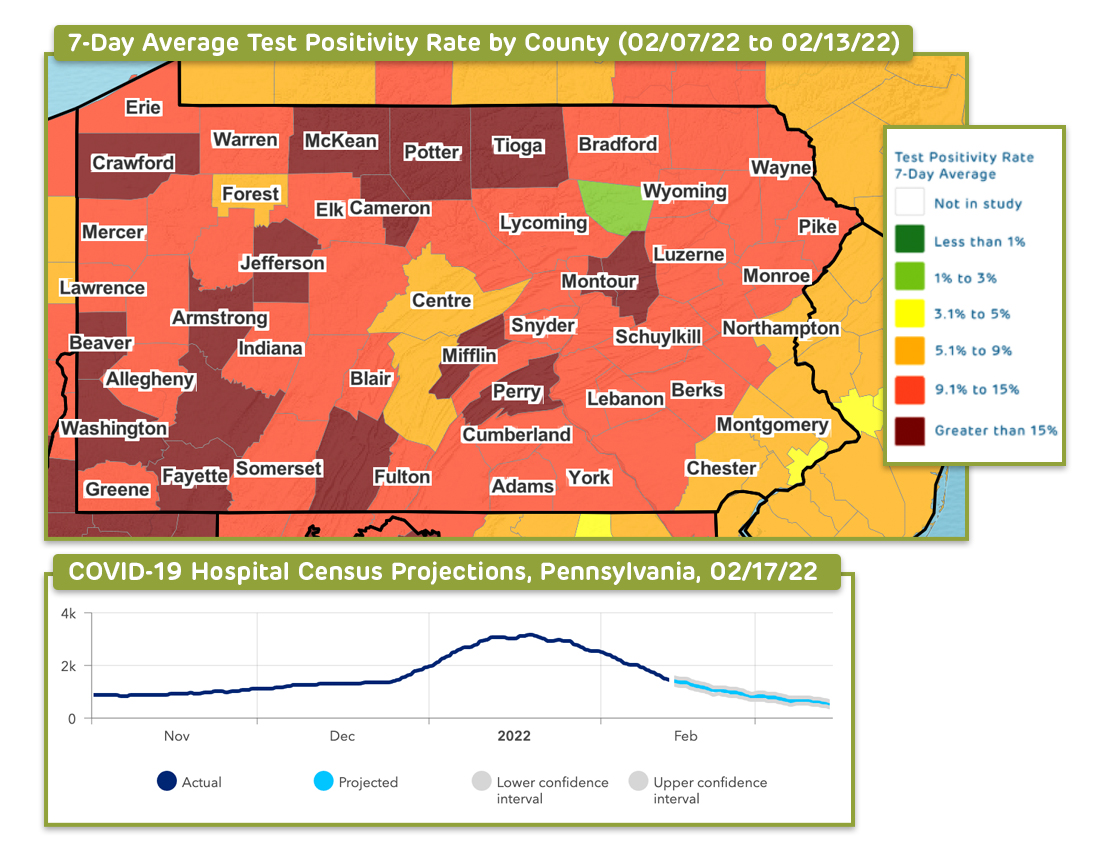
Through their COVID-Lab model, our interdisciplinary team across Children’s Hospital of Philadelphia and the University of Pennsylvania offered county-level data on test positivity and case counts from April 2020 to April 2022.
Through this project, our interdisciplinary team from Children’s Hospital of Philadelphia (CHOP) and the University of Pennsylvania has used county-level data to longitudinally track COVID-19 transmission and test positivity rates across all U.S. counties. Between April 2020 and May 2021, and again from September 2021 to February 2022, the models provided four-week projections of case transmission for as many as 821 counties with active outbreaks, representing 82% of the U.S. population and 83% of all identified coronavirus cases, and offered four-week state-level forecasts for hospital admissions and census. The 821 counties included those with state capitals, populations of 40,000 individuals or more (with a minimum population density of 250 people per square mile), and sustained outbreaks, which are defined further in this abstract.
Through these models, the team accounted for the impact of weather, health, demographics, county-level vaccination rates, and other local area effects of the population and city characteristics to develop forecasts that were calibrated to the actual rate of growth in county transmission during the prior week. The models considered over time the influence of temperature and humidity on SARS-CoV-2 transmission; determined the impact of social distancing in modifying the trajectory of SARS-CoV-2 transmission during current and future outbreaks; and parsed how city characteristics modified the risk of transmission.
The result was a highly dynamic model, rooted in the influence of environmental and behavioral factors on transmission, which could examine the effects of policy change and social distancing practices on the risk for virus resurgence. To guide community recommendations, the team also incorporated other key data into the models to permit more comprehensive assessments of local-area risk for COVID-19 transmission. Our dashboards offered visualizations that display a national map highlighting state-level COVID-19 intensive care unit occupancy, hospital daily census, new daily COVID-19 admissions and daily COVID-19 emergency department visits.
While the dashboards are no longer active, the team continues to use a variety of data sources to evaluate and validate their methodology and software for pandemic forecasting, real-time monitoring, mitigation, and prevention of the spread of pathogens, aiming to expand the applicability of the methods behind COVID-Lab to modeling the transmission of other infectious diseases. They are also training early career scientists in modeling transmission of pathogens in health care settings.
The data and methodology behind this modeling project was informed by a peer-reviewed study, published in JAMA Network Open, revealing social distancing to be the strongest mitigating factor in reducing COVID-19 transmission. Additionally, the team’s modeling efforts helped to inform a Health Affairs study, which found that county-level mask mandates reduced case incidence early in the pandemic, even if that effect waned over time.
The team utilized its modeling data to advise the White House Coronavirus Task Force, governors, state public health officials, and community leaders on emerging hotspots and local strategies for reducing the spread of the virus. Furthermore, the model has helped inform school guidance for the 2022-23 academic year—developed in partnership with CHOP’s clinical leadership—to support leaders of K-12 schools and early care and education settings with building their COVID-19 mitigation plans within the context of variable local health department requirements in different communities. To learn how we validated this model to ensure accurate projections, click here, and to learn more about the methods of this model, see this abstract.
Next Steps
As mentioned above, we will continue to monitor community transmission and may provide updates from time to time through PolicyLab’s social media channels and blog to help guide the public should conditions change. The team is also working on additional peer-reviewed articles based on this project and continues to mentor early career scientists in utilizing their modeling methods.
For more on PolicyLab's COVID-19 response and guidance to assist schools and communities with reopening strategies, click here.
This project page was last updated in October 2022.
Suggested Citation
Children's Hospital of Philadelphia, PolicyLab. Forecasting COVID-19 Transmission Across Time in U.S. Counties. [Online]. Available at: http://www.policylab.chop.edu. [Accessed: plug in date accessed here].