COVID-19 Outlook: A Country in Transition
After our COVID-Lab modeling update last week, we wanted to follow up on projections we made that are now validated in this week’s data.
Overall, national incidence rates have been slowing and hospitalizations have plateaued—but hidden in those numbers are regional transitions that are occurring. For example, the lower Midwest and Southeast are moving beyond their peak rates of summer transmission, but case incidence in the Northeast and Mid-Atlantic is now steadily increasing. This late summer resurgence in these locations is happening in parallel to an increasing number of large gatherings and school reopenings. This combination of events will likely result in more widespread community transmission for some regions, particularly those areas with lower vaccination rates.
Here are some of the principal trends we are seeing in the data:
1) The southern-most areas of the country are clearly rounding a corner, but progress will likely be slow: Reproduction numbers (a measure of transmission that estimates how many additional individuals, on average, will be infected by every positive case) are moving below 1 throughout the Southeast, indicating falling transmission. Still, improvements may be slow given the very high peak incidence rates in many areas. Hospital census will remain high for weeks and deaths will continue to accumulate, but for these areas that have suffered so much this summer, we hope that these data offer a light at the end of the tunnel. A good example is the city of New Orleans, which recently saw as many as 400 weekly cases per 100,000 individuals but is now improving.
Above is a graph showing daily COVID-19 cases in Orleans County (New Orleans) in Louisiana.
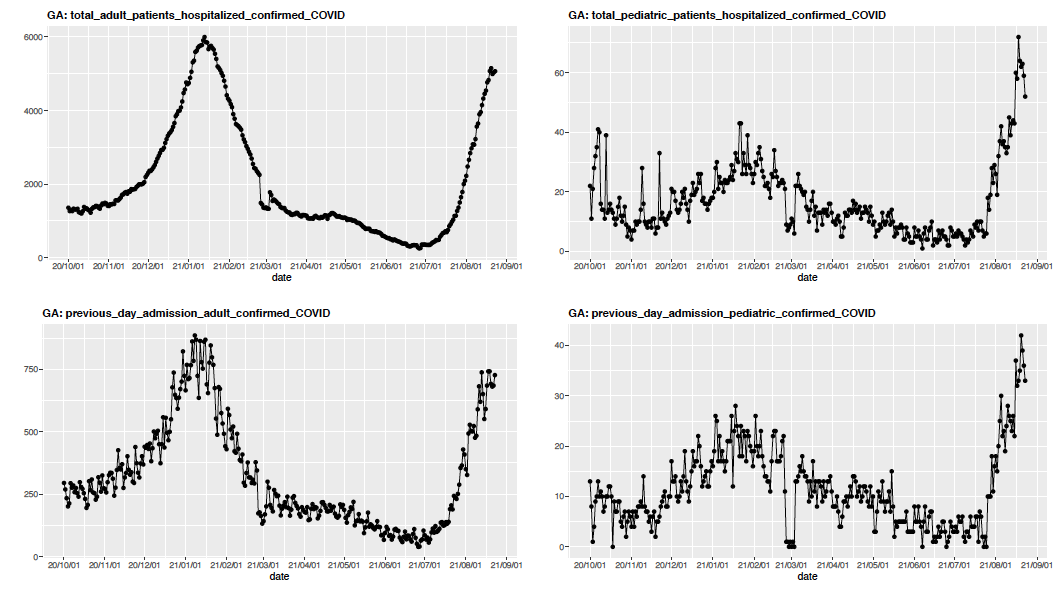
2) Areas just north of the lower Southeast are experiencing the largest growth in hospitalizations: Peak summer transmission is now occurring from Georgia to North Carolina and Tennessee to Kentucky. The growth of hospitalizations in these states resembles what we saw in Florida and Louisiana just a couple of weeks ago. The accompanying graph (click to enlarge) of adult hospital census in Georgia demonstrates how quickly hospitals have filled throughout the state.
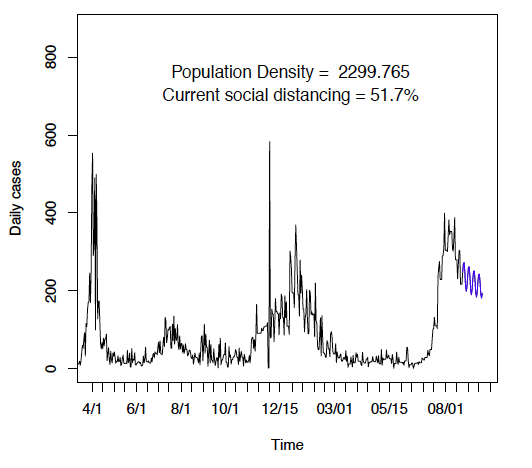
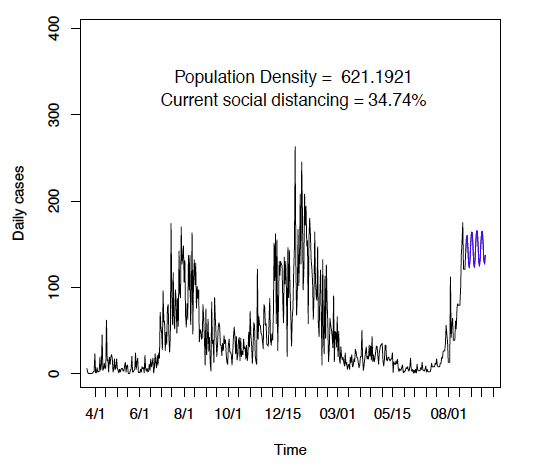
3) As schools reopen for full in-person instruction and large entertainment and sporting events continue to occur, many areas are at risk for accelerating transmission: We have voiced concern about the risk for an early fall “double-bump” in community transmission fueled by school reopenings and large events occurring at a time when many adults and children have COVID-19, particularly in communities with low vaccination rates and in the face of the more transmissible delta variant. We are now seeing evidence of this effect. You can see from the graph below of case incidence in Augusta, Ga. (Richmond County), that the county experienced a resurgence in cases after schools reopened in early August; pediatric and adult hospitalizations have also increased significantly in this time period. We observed a similar trend in Las Vegas (Clark County, Nev.), which had appeared to be beyond its summer peak when schools reopened on August 9. Such bumps are likely to occur in areas that have not yet moved beyond peak transmission and may slow progress in areas that appeared to be improving.
Above is a graph showing daily COVID-19 cases in Richmond County (Augusta) in Georgia.
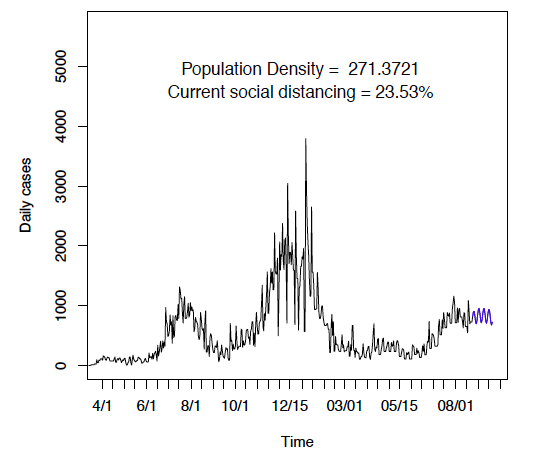
Above is a graph showing daily COVID-19 cases in Clark County (Las Vegas) Nevada.
4) The Northeast has still not reached its peak of summer transmission and remains at risk for early fall resurgence: We are forecasting continued case growth along the I-80 corridor from Indiana to New Jersey and up the I-95 corridor from the Washington, D.C. metro area into greater New England. This is increasing the likelihood of an early fall peak between September and October in the Northeast, well in advance of Thanksgiving. We are seeing similar patterns of growth in the Southwest and in Southern California, while the Upper Midwest is growing more slowly. A look at Brooklyn, N.Y., raises concern about the coming weeks in this highly populated region, particularly as schools reopen and large sporting events return after Labor Day—all during a period of surging transmission. This forecast is very similar in other areas around New York City, as well as for Philadelphia, Baltimore and Washington D.C.
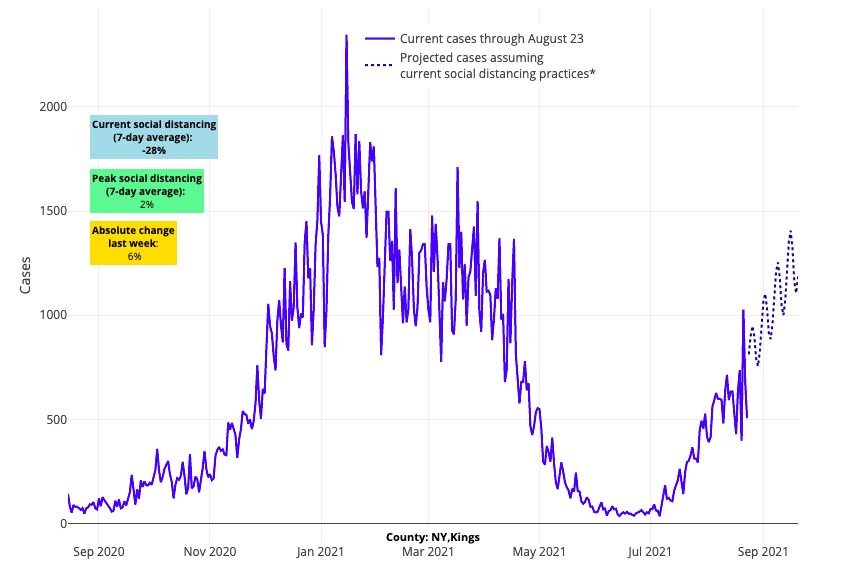
Above are the projections for Kings County (Brooklyn) in New York.
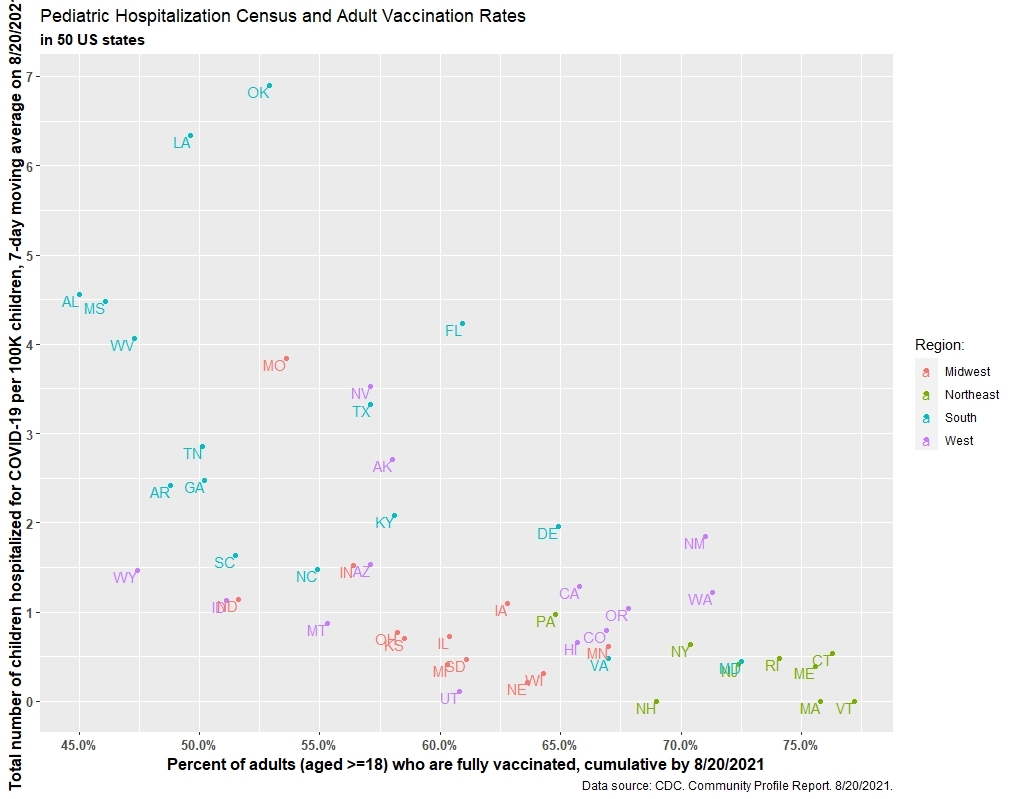
5) Even as COVID-19 transmission has increased rapidly among children, states with higher adult vaccination rates are faring better with pediatric hospitalizations than those with lower adult vaccination rates: The accompanying graph (click to enlarge) demonstrates just how strong of a protective effect adult vaccination can have on the risk of pediatric hospitalization. As children under 12 years of age are not yet able to be vaccinated, the best way to protect children from the low, but appreciable, risk of severe disease is to optimize vaccination rates for adolescents and adults in our communities in advance of winter.
We’ll be back next week with a full set of four-week county-level case incidence projections. In the meantime, we have resumed posting county-level incidence and test positivity rates each week to equip communities with the data they need to inform individual responses to this resurgence. We are also posting state-level adult hospitalizations and emergency department data, as well as pediatric admissions and hospital census. Be sure to check out the COVID-Lab landing page for all of these data.
