COVID-19 Outlook: Recovery Continues, But Some Regions Lag Behind
Our COVID-Lab modeling team is releasing new models this week, which debut statewide four-week forecasts for adult hospital admissions and census. In reviewing these new projections and our county-level case incidence forecasts, it’s clear that the nation on the whole is recovering. The number of counties starting to experience steep declines in case incidence and hospitalizations will continue to grow over the next four weeks. Importantly, those that have not yet reached their peaks are projected to do so in the coming weeks.
Here’s a look at current and projected hospital data from across the country:
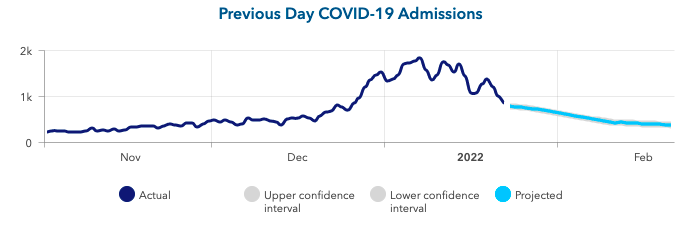
- Adult hospital admissions are now declining in a majority of states; the largest proportional drops in admissions this week occurred in the Northeast and Upper Midwest. Our hospital projections reveal that the steepest declines will happen in states with very large metropolitan areas, like New York, Florida and California.

Above is a graph showing previous day COVID-19 admissions (actual & projected) in New York.
- States with a more than 10% decline in adult hospital census last week included Delaware, Maryland, Illinois, New Jersey, Ohio and Rhode Island. Washington, D.C. had a nearly 20% decline in hospital census this past week.
- Some states are still experiencing an increase in their hospital censuses, including Alaska, Montana, Wyoming, Idaho, Alabama, North Dakota and Oregon. Fortunately, our forecasts show hospital census will improve in states across the Heartland over the next four weeks, and the Pacific Northwest is likely just a week behind. In total, our models forecast declines in adult hospital admissions and census in every state by the end of February.

Above is a graph showing COVID-19 hospital census (actual & projected) in Missouri.

Above is a graph showing previous day COVID-19 admissions (actual & projected) in Missouri.
- A few weeks ago, New Mexico and Arizona appeared to be approaching their peaks in case incidence and hospitalizations, but they continued to experience rising hospital admissions and census. Our case incidence models and hospital projections both show that this region will not pass their peak for case incidence, admissions and census until mid-February.
- While much of the South is now improving, Kentucky, Tennessee, and North Carolina, have had stubbornly high hospital admissions and census, with projections suggesting a slower recovery than areas to their north and south over the next four weeks.

Above is a graph showing COVID-19 hospital census (actual & projected) in Tennessee.

Above is a graph showing previous day COVID-19 admissions (actual & projected) in Tennessee.
- Pediatric hospital census is now declining in many states, with national census down 20% in the last week. The largest declines are in the Northeast and Upper Midwest. Pediatric census is increasing in states in the Heartland, Mountain West and Pacific Northwest. We also continue to see sustained high census for children in states across northern New England.
- Steep declines for emergency department visits are now evident in the Northeast and Southeast. In New York, emergency department volume is at its lowest level since last summer.
Let’s take a look at testing positivity and transmission trends next:
- The average PCR testing positivity rate across the 812 counties included in our model remains unchanged from last week at 33%. However, a majority of counties had a lower testing positivity rate than the week prior. The largest declines in test positivity rates continue to be in counties in the Northeast and New England. Test positivity rates are also declining widely across the Southeast and Upper Midwest.
- A majority of the counties we follow have a reproduction number (otherwise known as R, a measure of transmission that estimates how many additional individuals, on average, will be infected by every positive case) under 1, indicating declining transmission.
While many of the metrics we follow are improving at the state and county level, we wanted to note some unique trends unfolding:
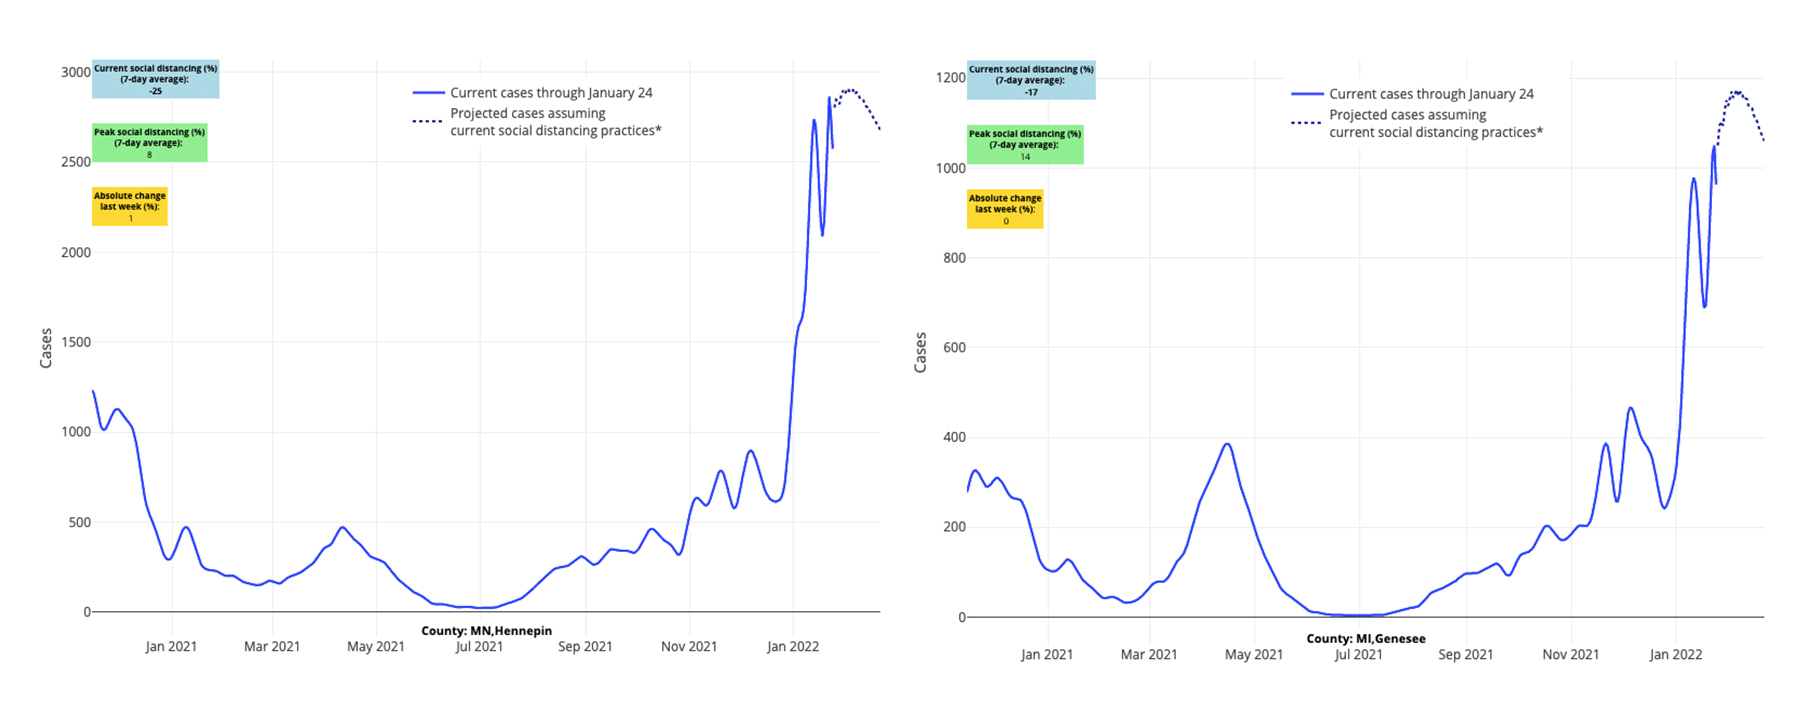
- The persistence of high case incidence and hospitalizations along the northern rim of the country is more evident this week. Our projections from Maine to Washington estimate that declines in case incidence will be slower than areas further south. Forecasts from our new hospitalization models suggest that these regions may stay near peak hospital admissions and census over the coming weeks.

Above are the projections for Hennepin County in Minnesota (left) and Genesee County in Michigan (right).
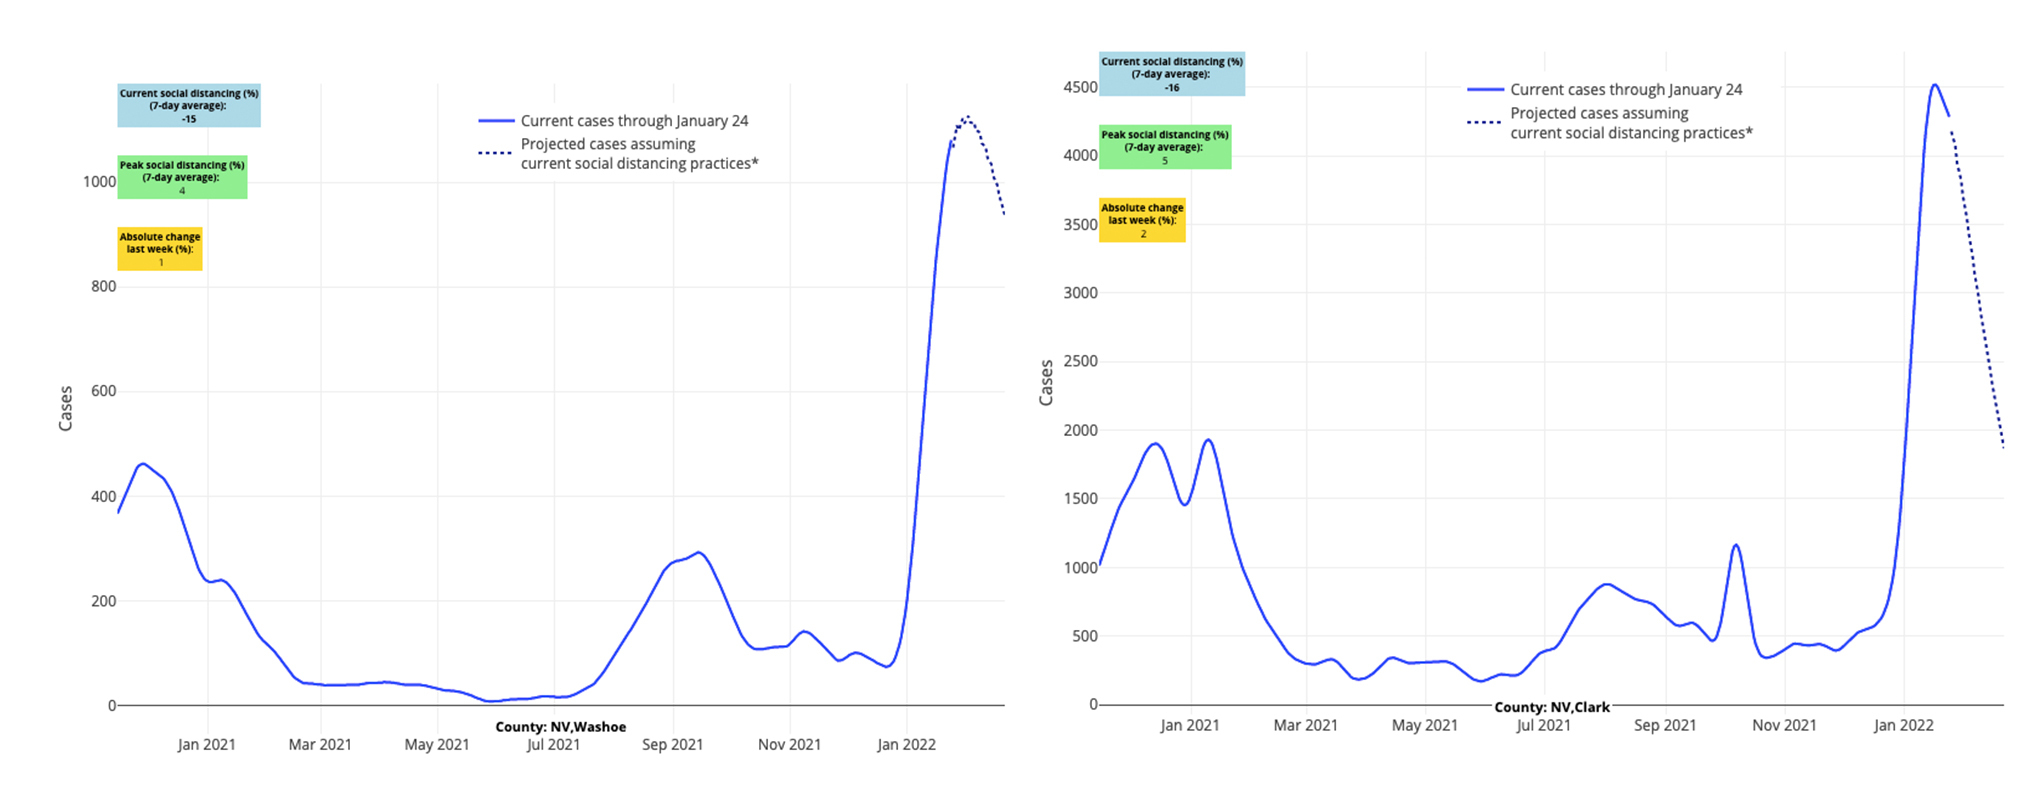
- Seasonal impacts in counties home to popular ski destinations across the Mountain West remain apparent in our case incidence projections. This is most evident in Nevada, where our forecasts for the Tahoe region show sustained high case incidence over the next four weeks.

Above are the projections for Washoe County in Nevada (left) and Clark County (Las Vegas) in Nevada (right).
- Reproduction numbers have been slower to improve in rural areas. The average population density of counties with reproduction numbers under 1 (i.e., increasing transmission) was 320 people per square mile. On the contrary, the average population density of counties with a reproduction number below 1 (i.e., declining transmission) last week was 1,100 residents per square mile.
Growing regions of recovery lend optimism for the spring
In our blog post last week, our team projected that the number of counties in which case incidence was declining would quickly become the majority, hastening national recovery as we move into February. This week, that projection has largely borne out. Recovery has been greatest in the Northeast and Southeast. For example, case incidence has been cut in half in counties across the Northeast, particularly in and around the New York City metropolitan area. Similar trends are now unfolding on the southeastern coast of Florida. And very soon, we anticipate similar developments in California’s metropolitan areas. These trajectories suggest that we are likely to see a spring with very low case incidence.
There are areas where case incidence and hospitalizations remain high. This includes counties and states in the Heartland, Mountain West, and Pacific Northwest, and somewhat surprisingly this week, the Desert Southwest. Our models for these areas, the Northwest and Desert Southwest in particular, suggest the pace of recovery in these regions may be slower. Fortunately, we are seeing declines in emergency department visits for some locations in these regions—a signal of the beginning of recovery. Additionally, our new hospital admissions and census models show improvements in the Heartland over the next four weeks, suggesting they are likely to join a growing region in the Midwest that will be recovering throughout the month of February.
Introducing new projections for hospital censuses & admissions
We’re debuting new models this week that project state-level adult hospital admissions and census over the next four weeks. Our team’s introduction of these new models reflects our prioritization of hospitalization data as a key measure for assessing the ongoing impact of infections at this point in the pandemic.
While case incidence remains an important metric, there are a number of factors that are limiting the interpretation of this measure, including:
- The consistency of state case incidence data has worsened since December.
- Access to tests has become more variable across regions, creating a situation in which some regions might have more responsive case incidence curves as they test more people, while others may remain flat and high due to saturation of testing capacity.
- Some counties may have an increase in the use of rapid home tests from which results are not captured in public health reporting.
- Many areas, particularly large cities, are still prioritizing weekly testing of asymptomatic individuals, which can greatly elevate reported and projected case incidence during a period of widespread transmission.
Given the limitations of case incidence measurements, our team has focused for months on deriving, calibrating, and validating new models that project hospital admissions and census. We believe these state-level models of hospitalizations provide a more informative picture of the current and projected impact of the pandemic.
The approach to the models has been more complex than our case incidence models, in that we use the output of county-level case incidence projections, weighted by county population density, to help predict hospital admissions across each state. These models are also informed by data for emergency department visits (including recent trends in visits) and testing positivity rates. Projected hospital admissions are subsequently added to a model that predicts hospital census, which are further informed by how long adults have been staying in the hospital during the omicron wave. This latter component is important as hospital census is directly related to both the number of admissions and the duration of those admissions.
The overarching story from these models projects continued national recovery in the coming weeks. However, they do highlight variation in regional recovery with delayed recovery forecasted in some pockets of the Southeast, Desert Southwest and along the northern rim of the country. Fortunately, the models project declining admissions and census in all states by the end of February.
We’ll be back next week with new case incidence and hospitalization projections, and we will begin to discuss the broader implications of this recovery on reducing required restrictions in schools and communities as we move toward spring.
