COVID-19 Outlook: In the Eye of the Hurricane
With the window open for safely getting kids back into the classroom (which we blogged about last week), our teams at PolicyLab have been busy working with local school districts who are accelerating plans for in-school instruction. The question for many now is how long will this window stay open?
We suspect that the answer will depend on where you live, and how well your community is still demonstrating the vigilance to combat the spread of COVID-19 as we move toward winter.
Already we are seeing the parameters form. The reopening of college campuses was the first challenge at the onset of fall. Increased case rates in many areas have been linked to college towns struggling with outbreaks after their students returned to campus. Colleges with strong mitigation plans have been able to quell their caseloads, while those with less defined strategies have seen case numbers continue to mount. As regions attempt to resume additional activities—such as youth sports leagues or reopening bars and restaurants—a unified commitment to mitigation strategies to keep case numbers down will be extremely important. Inconsistent enforcement of these strategies can undermine an overall safe return to these activities.
For example, we are supportive of restaurants reopening; there is lots of evidence they can open safely under certain restrictions (e.g., no bar-top service). But when individual establishments reject guidance on limited occupancy, this increases likelihood of increased case counts and jeopardizes the reopening of other restaurants in the same area that are trying to follow the rules, as well as the community’s ability to get kids back in the classroom. The interconnected nature of these entities is important to recognize as we transition to cooler fall weather. If a united front is not maintained, a community can quickly find itself with a surge in cases.
One doesn’t need to look any further than our forecasts this week to see what may be coming. The resurgence in the Upper Midwest has quickly worsened in states like Minnesota and Wisconsin, where hospitalizations are beginning to increase again. We are also now seeing widespread increased transmission risk in the Mountain States, from Flagstaff, Ariz., up to Utah, through Colorado (around Denver and Boulder), and north into areas of Idaho and Montana. Interior areas of Washington state have moved past their nadir; Yakima and Spokane are growing again.
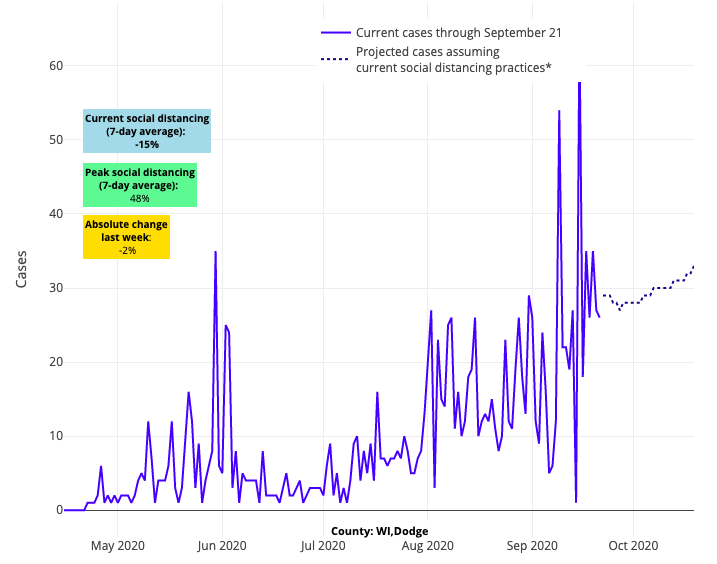
Above are the projections for Dodge County in Wisconsin.
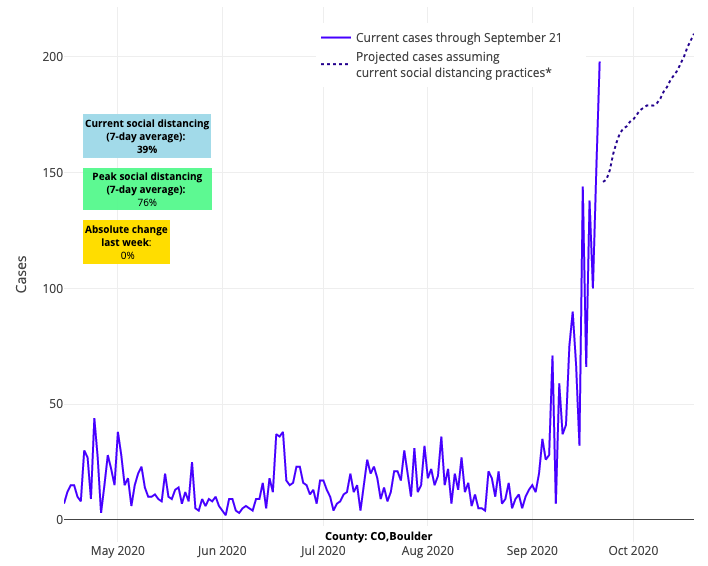
Above are the projections for Boulder County in Colorado.
All told, these confluent effects in the Upper Midwest and Mountain States are a bellwether warning of what may be coming with colder weather. Increased case counts and risk in the Blue Ridge mountains, Appalachia, and Anchorage and Juneau, Alaska provide additional warnings that colder temperatures will facilitate transmission as our models and published research have previously denoted. While areas of the Mid-Atlantic, like North Carolina, Virginia and Maryland, and Northeast are bright spots for recent improvement, the entire eastern seaboard should take notice of what is transpiring in these other communities; the resurgence there is confirming what may be in store if we don't remain vigilant.
That being said, the West and many areas of the South continue their steady improvement. While concerns over incomplete reporting of testing results across Texas undermine confidence in reported numbers (more on that later), Houston has clearly improved from where it was earlier in the summer. Even the long-standing hotspots of South Carolina and Tennessee are showing signs that testing positivity is abating, even as their case counts are more slowly declining than other places in the South. Our current projections for Miami and the southeast Florida coastline are looking more like they did early in the spring with case counts were low and manageable across the state.
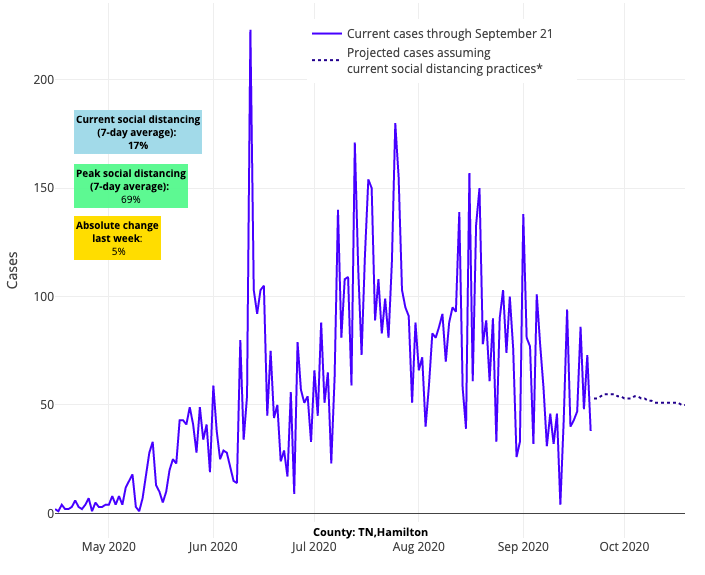
Above are the projections for Hamilton County in Tennessee.
As noted above, there is optimism this week that college outbreaks are beginning to subside on many campuses including in Ames and Iowa City, Iowa; Columbia, Mo.; Tuscaloosa and Auburn, Ala.; Athens, Ga.; Bloomington Ind.; and Morgantown, W.Va. The fact that these local outbreaks are decreasing in a similar time frame despite variable mitigation strategies, invokes the possibility that increasing seroprevalence among young adults in these locations could be providing a certain degree of herd immunity to the campus community. As always there are many variables that can lead to a decline in incidence and it is too soon to tell if these college towns have had enough individuals recover from infection to thwart the anticipated increased transmission in the upcoming cold weather season. Nonetheless it is interesting to consider this a reasonable possibility.
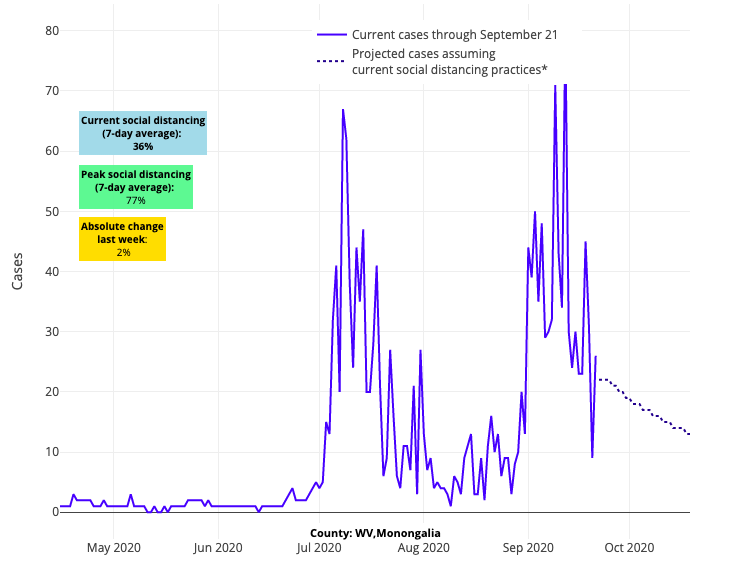
Above are the projections for Monongalia in West Virginia.
As we look to monitor this pandemic into the fall and winter our team remains most concerned about the integrity of the data we will be using to predict county-level risk. We have been highlighting for several weeks now our concerns that the arrival of new antigen tests in September has infused uncertainty regarding the reporting of case numbers by states. News outlets are now highlighting the variability in reporting of antigen test results to the Centers for Disease Control and Prevention from state to state; most concerning is that a number of states are not considering positive antigen tests at all in defining their case numbers.
Just this week, we produced a number of scenarios for the White House Coronavirus Task Force that illustrate this concern. Seeing testing positivity superimposed on daily case incidence is telling. This has been a particular problem in Texas, and we are now seeing evidence that data from other states, like Georgia, are also becoming unreliable. First, to get your bearings, take a look at the scenario for New Orleans, where testing positivity trends perfectly match weekly case incidence. This is how it should look for every county.
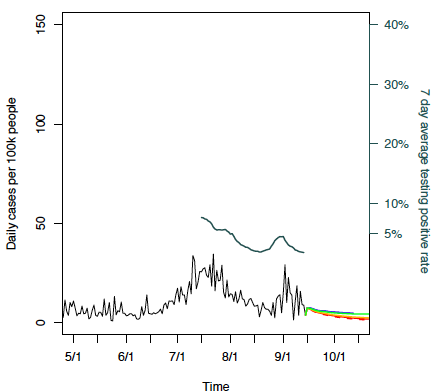
Above is the scenario graph for Orleans Parish in Louisiana.
Now, let’s take a look at Fulton County, Ga. (Atlanta). You’ll see that PCR testing positivity remains extremely high, while reported case incidence is quickly dropping. This mismatch between high test positivity rates and rapidly declining case incidence suggests that cases are not being counted, or that people in the region have suddenly lost access to testing. We know that Georgia has already deployed over 50,000 antigen tests with testing positivity approaching 30%. However, reported positivity rate and case load rate suggests that these antigen test results are not being considered in the reporting process.
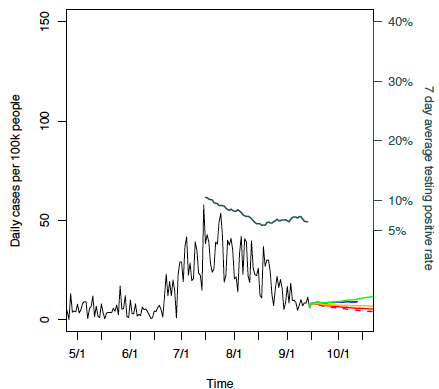
Above is the scenario graph for Fulton County in Georgia.
The integrity of data in Texas is perhaps even worse. As antigen tests have been arriving, Texas has been adding the number of antigen tests performed to the denominator, but has not included positive antigen test results to the numerator. This approach, which has no justification, has falsely reduced testing positivity and misled the public in communities like Dallas and Tarrant Counties. We suspect these issues will only worsen unless stricter national requirements require all states to report positive antigen tests in their state totals.
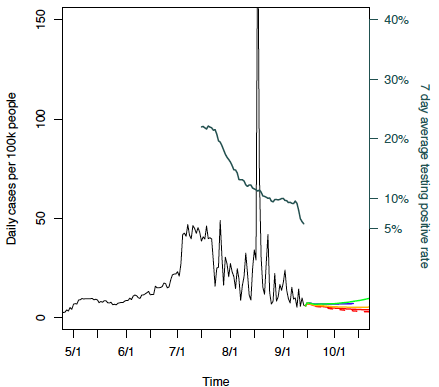
Above is the scenario graph for Dallas County in Texas.
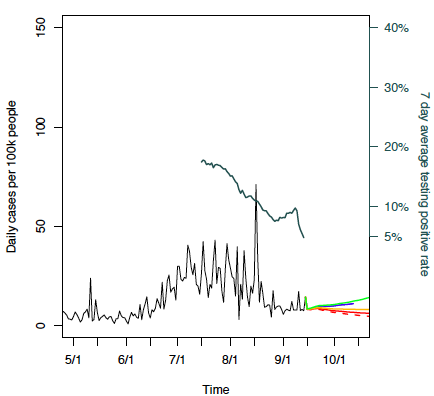
Above is the scenario graph for Tarrant County in Texas.
Last week, we had optimism abound as we moved past Labor Day. This week, we worry that a window of opportunity may close quickly in many locations, even as others, particularly in the Northeast and areas of the South and West, are enjoying stable forecasts. Our optimism remains, though, for those communities that remain vigilant in their COVID-19 prevention and mitigation practices. Those are more important than ever as we see the cooler temperatures of fall.
All told, across the national scene, our footing has gotten more tenuous this week, even as we remain uncertain as to the timing and amplitude of the coming wave, and the data we will need to see it coming.
Gregory Tasian, MD, MSc, MSCE, is an associate professor of urology and epidemiology and a senior scholar in the Center for Clinical Epidemiology and Biostatistics at the University of Pennsylvania Perelman School of Medicine. He is also an attending pediatric urologist in the Division of Urology at Children's Hospital of Philadelphia.
