COVID-19 Outlook: The Northeast Resurgence Has Begun, but Safe School Reopenings Still Possible
Last week, we shared our most concerning forecasting update since the spring when our models predicted the surges that ultimately occurred across Texas, Florida and California. This was driven by our data demonstrating a clear pattern of rising test positivity rates and case incidence in the Midwest, Heartland and Mountain States. The worsening projections in these northern regions also reinforced concerns that decreasing temperatures will confer higher risk for transmission and possibly disease severity.
This week, not only do these concerning trends continue in the Midwest—much of Indiana is worse and the Chicago area continues to move in the wrong direction—but our projections for the Northeast and Mid-Atlantic have worsened as many counties across multiple states are seeing increased test positivity rates. In New England, our projections for Massachusetts, Rhode Island and nearly every county in Connecticut are worse, and resurgence risk is increasing in New Hampshire and Maine.
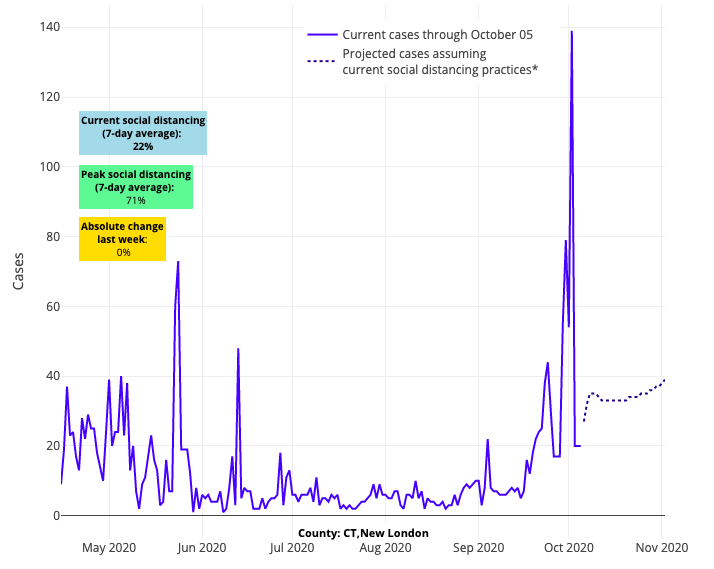
Above are the projections for New London County in Connecticut.
We’re also seeing outbreaks developing throughout the entire state of New York, with substantial outbreaks in Binghamton and Rockland Counties. Transmission risk is increasing again in all five New York City boroughs, led by Brooklyn, even as the city attempts to add restrictions in ZIP codes with the highest rates of transmission.
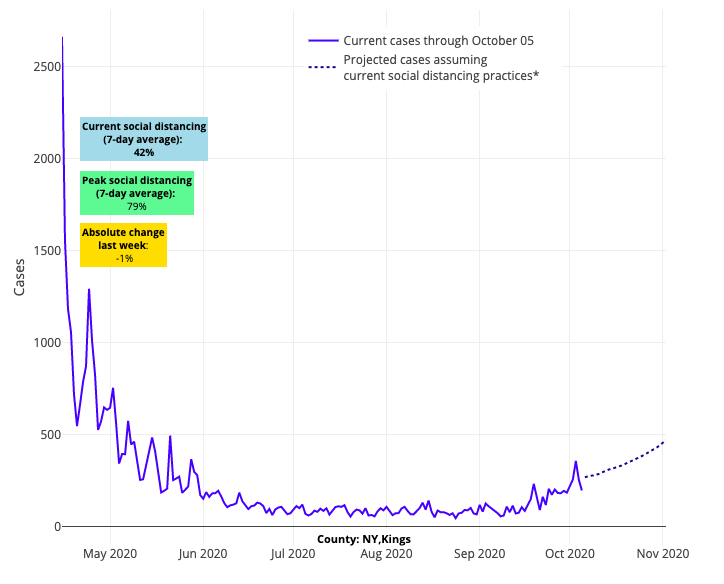
Above are the projections for Kings County (Brooklyn) in New York.
In the Mid-Atlantic, Pennsylvania and Delaware are trending in the wrong direction, with Philadelphia seeing 90 new cases weekly for every 100,000 residents. Thus far we are seeing stable numbers across Virginia and Maryland, but as the temperatures cool from north to south these states will be important to watch.
Finally, not to be overlooked, are the quickly increasing numbers in parts of the Pacific Northwest. Oregon now has to be considered one of the most concerning states in the country with rapidly accelerating test positivity rates. The state of Washington is not as bad as Oregon, but projections have worsened in counties such as Spokane and King (Seattle).
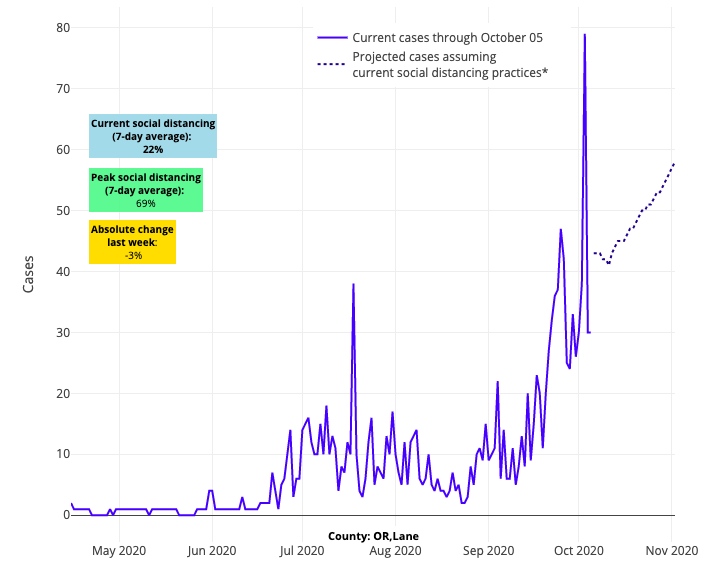
Above are the projections for Lane County in Oregon.
Alongside our new four-week projections, there are three issues we’ll want to watch closely to understand the severity of this emerging fall/winter wave:
Weather
Whenever we hear suggestions that this virus has become milder over time, we are quick to caution that those prognostications—and sometimes data reviews—fail to consider the weather-related impacts on transmission risk of SARS-CoV-2, the virus that causes COVID-19. In July, we published data in JAMA Network Open suggesting that transmission of this virus would be increased at both ends of the temperature spectrum. This included expected sustained transmission in the hot temperatures and humidity of summertime (something the lower half of the country experienced), but also enhanced efficiency of the virus to spread in the colder temperatures (which we are concerned is beginning to play out across the north).
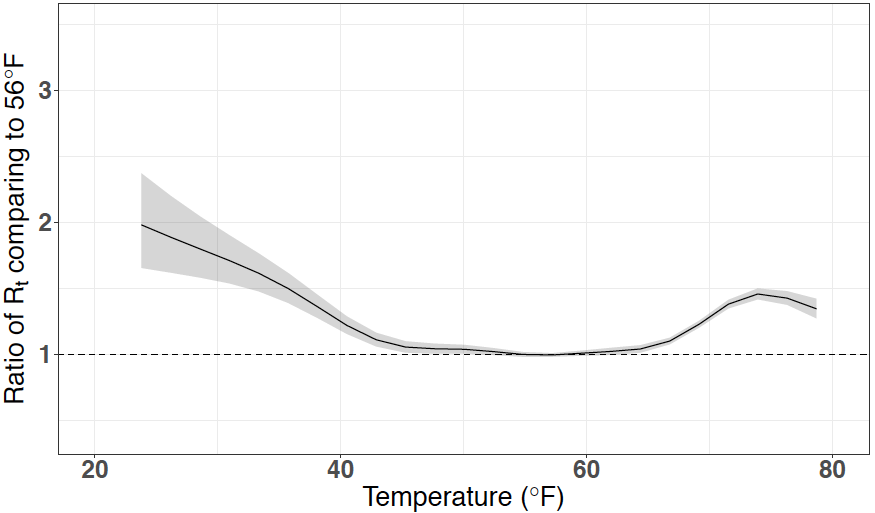
Below is a figure from our study, which displays the non-linear effects of temperature and humidity on COVID-19. We combine temperature and humidity into a wet-bulb temperature, which is usually 10° degrees less than the temperature you see in weather forecasts. The vertical axis demonstrates the ratio of Rt, the instantaneous reproduction number (also known as the transmission rate), at each temperature, compared to a reference wet-bulb temperature of 50°F. You can see that transmission rates were increased nearly 50% with higher wet-bulb temperatures. On the other side of the spectrum, where temperatures are cooler and humidity is less, the transmission rate also rises, and the increase is more than 100% compared to the reference temperature of 50°F.
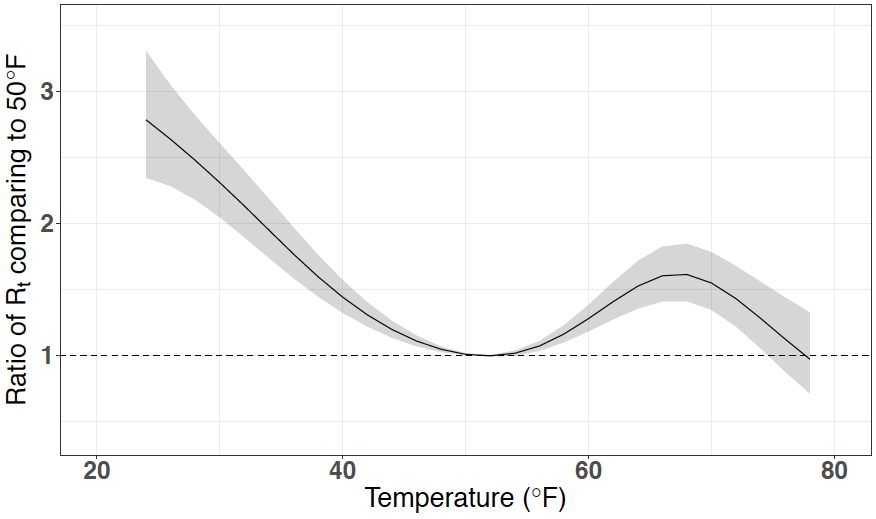
Figure legend: Cumulative Lagged Temperature Dependence of the Instantaneous Reproduction Number of Severe Acute Respiratory Syndrome Coronavirus 2 in 211 U.S. Counties. Cumulative exposure-response association between mean daily wet-bulb temperatures and instantaneous reproduction number using a lag period of 4 to 14 days before case identification. The line represents the estimated instantaneous reproduction number at each point along the temperature range compared with 11°C. The shaded areas represent the 95% CIs. The wet-bulb temperature range for the counties included in the analysis was −9°C to 25°C. *Source: JAMA Network Open
Those original models were inclusive of 211 counties. We have now reproduced our analysis (see below) using different models and data from 817 counties gathered throughout the summer and early fall and found a strikingly similar result. What we are currently witnessing throughout the northern regions is only further supporting the accuracy of these data.
Hospitalizations
While our models do not capture hospitalizations, we are concerned when our projected rise in case counts happens alongside upticks in COVID-related hospital admissions. We see this clearly in Wisconsin, but many states are showing similar patterns, including Massachusetts (see graph below). We suspect that lower temperatures are allowing respiratory droplets to suspend in the air longer, which could lead to greater transmission and possibly greater inoculum of exposure (and therefore more severe cases requiring hospitalizations). This we will need to watch as weather grows colder.

*Source: Massachusetts Department of Public Health COVID-19 Dashboard
Who is Becoming Infected
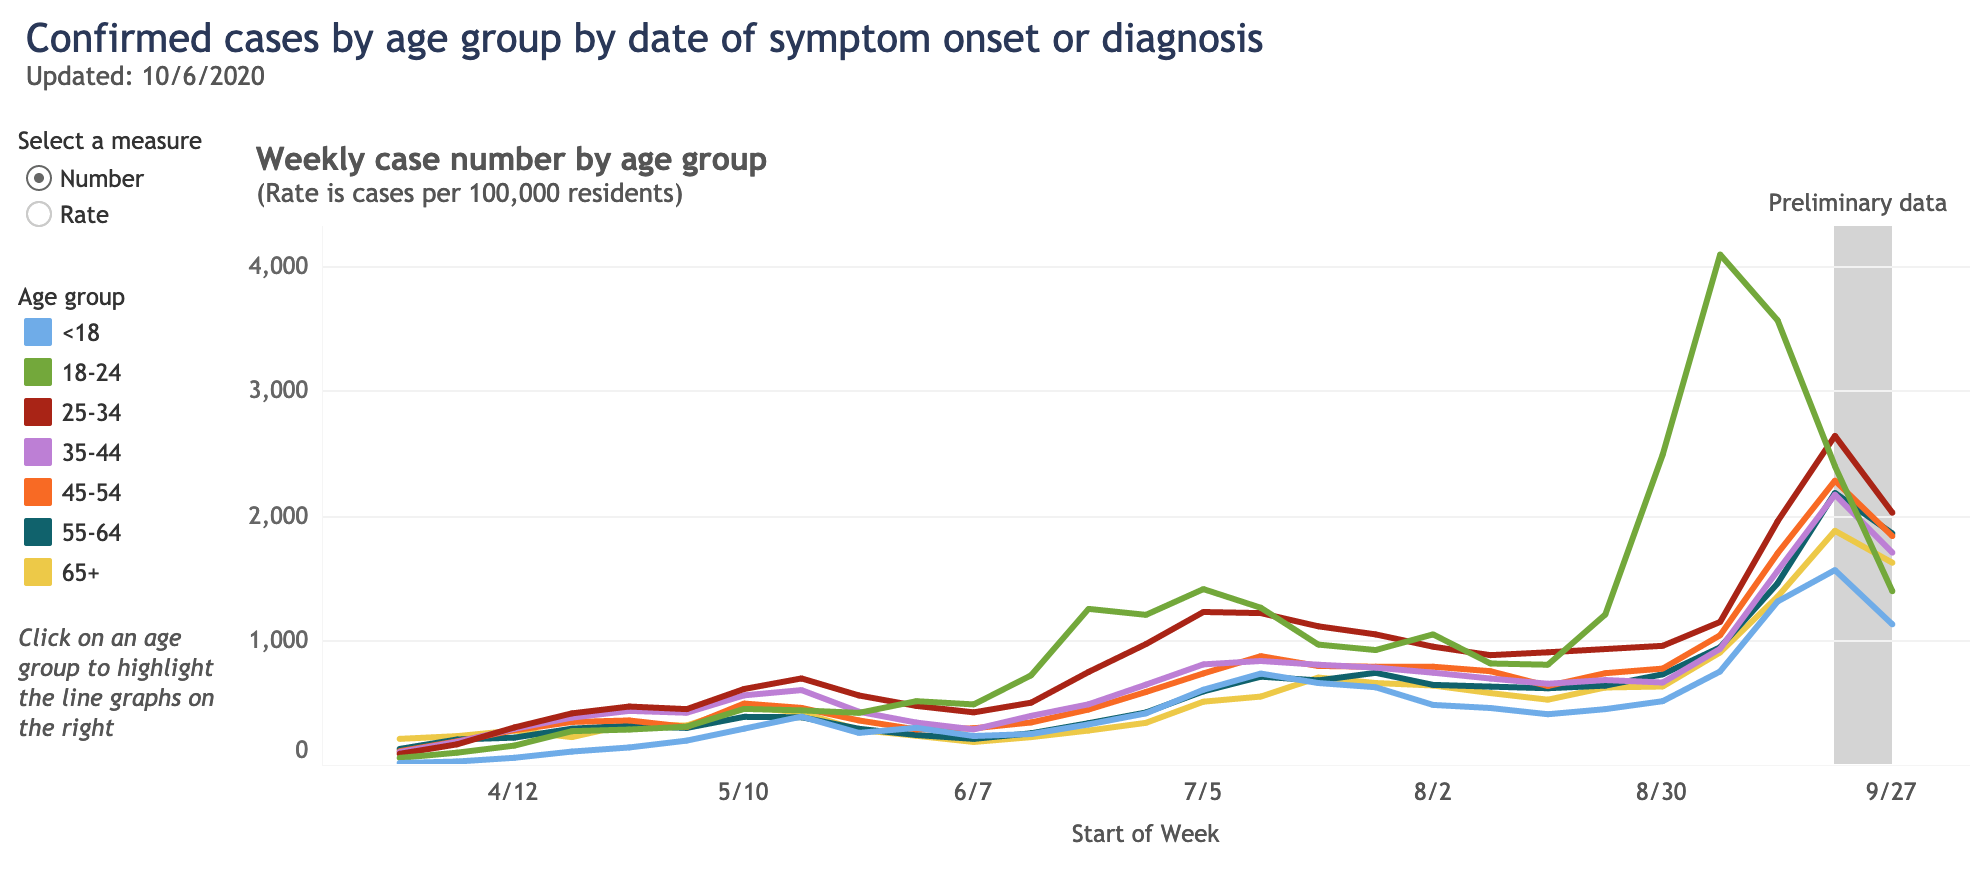
We’ve seen a shift recently in who is becoming infected, with the spectrum widening from young to old. Reviewing data from Wisconsin’s public health system, a state with recent widespread transmission, confirms this. Interestingly in Tennessee, hospitalizations are increasing even as their case incidence remains flat, likely because cases are shifting to older, more vulnerable people. Tennessee’s data is a reminder to not simply review the total numbers of those who are infected, but try to drill down to age-specific rates.
*Source: Wisconsin Department of Health Services
As we have said all along, we do have tools to combat this changing landscape of risk including persistent commitment to mask use around anyone who doesn’t live in our households and reducing our gathering sizes. Many of us have let down our guard with our own siblings, parents, children, and grandchildren over the last couple of months, and there is strong evidence that significant transmission is occurring during these family gatherings.
Meanwhile, as we turn our attention to school reopenings that have proceeded even as disease burden is beginning to climb in many communities across the country, we are receiving many questions about whether to continue incremental reopening that starts with elementary school-age children and children with special education needs. Additionally, with community disease activity rising, and convincing evidence that older youth are more likely to transmit the virus than young children, the natural question has been whether to halt the reopening of middle and high schools for in-school instruction.
It’s reassuring that, barring quickly accelerating disease or tremendously high disease burden in a community, thus far we are seeing very little evidence of in-school transmission between students or from students to staff. Additionally, there is no convincing evidence that modest rises in community disease activity confer additional risk to in-person learning or drive outbreaks that originate in schools. To continue monitoring this, we need to rely on our health departments more than ever. In southeast Pennsylvania, for example, the local health departments are doing meticulous contact tracing and actively searching for evidence of in-school transmission. That they have not found such evidence is comforting and can provide a compass by which cautious school reopenings should proceed.
Until we see evidence from our health departments that in-school transmission is developing, we would suggest there is a strong case to be made for school districts that have not yet opened for in-class instruction to begin reopening for students in elementary school and those with special education needs. Despite the increased transmission risk associated with older children, the considerations for reopening middle and high schools include some advantages for those districts already undertaking reopening plans. Specifically, because of the maturity of their students, these schools may be better able to ensure distancing and masking protocols are maintained in the classroom—lowering transmission risk from what these youth could experience in the community. In fact, for children of all ages, we are seeing that the most substantive risks are in family and community environments. As districts reopen, it will be important for schools to create a sense of shared understanding and commitment to infection control in home and community settings among all members of the school community.
We are planning to update our school reopening guidance in the next week, to move away from the absolutism of case incidence thresholds toward a stronger reliance on the effectiveness of contact tracing in schools and the availability of rapid testing. We believe future decisions to revert to distance learning or halt school reopenings can now be more directly informed by whether uncontrolled community transmission is occurring (as evidenced by quickly rising positivity rates) or if community outbreaks are found to originate from schools.
We feel confident that the protocols we are recommending can create a safe school environment for most. That said, we—and certainly public health professionals throughout the country—are carefully reviewing data each week and will continue to calibrate guidance based on our collective interpretation. Our modeling data suggests there are challenging weeks coming; we cannot promise the right answers, but we will be honest in our dialogue and open to adjusting our guidance in this dynamic period of the pandemic.
Gregory Tasian, MD, MSc, MSCE, is an associate professor of urology and epidemiology and a senior scholar in the Center for Clinical Epidemiology and Biostatistics at the University of Pennsylvania Perelman School of Medicine. He is also an attending pediatric urologist in the Division of Urology at Children's Hospital of Philadelphia.
