COVID-19 Outlook: Buckle Up, The Ride is About to Get a Bit Bumpy
There are many reasons to be cautious about over-interpreting the modeling data we are seeing this week, and in the next couple of weeks to follow. America is on the move—back to school, back home from vacations—and the impacts of these transitions are going to take time to sort out. We are also preparing for new rapid antigen testing kits to hit the market, which, if not reported on properly, could threaten the integrity of the public health data we rely on to closely follow the pandemic throughout the country.
Transitioning from Summer to School
Last week was perhaps our final week for seeing clear summer patterns before most students began returning to schools and colleges. We detected growing risk in California, particularly in the north, and in the midsection of the country, all of the way up to the Upper Midwest. And at the time, the mid-Atlantic and northeastern states were holding—no better, no worse.
Now, with Labor Day almost upon us, we find ourselves bracing for the uncertain impacts that another weekend of holiday travel could bring. We could see another round of resurgence as people take advantage of the last official weekend of summer. Or, if people have already begun to hunker down and many college students are already on campus, we might expect to see some lengthened, but modest, risk before Labor Day, followed by declines again in early September. Optimistically, this latter scenario could present an opportunity for some school districts that are starting the school year with online learning to reopen later in September.
However, on the whole, these transitions back to school have had a bumpy start. And data from Berlin and Seoul have clearly suggested that keeping schools open will be a challenge. Stateside, many college towns have welcomed students who arrived on day one introducing significant disease burden to campuses and the surrounding community. The University of North Carolina (UNC) and University of Notre Dame both reverted to online learning within a week of reopening, and the University of Alabama saw more than 550 students test positive for COVID-19 in week one. What’s more, Orange County, NC, home to UNC, more than tripled its test positivity rate in just the last few weeks, not to mention weekly case incidence that has quickly surged well over 300 cases per 100,000 residents.
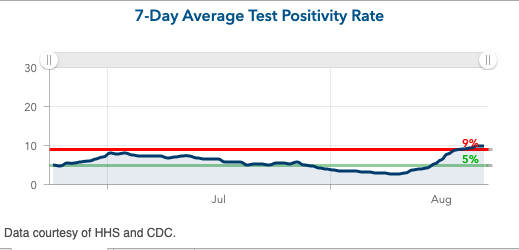
Above is the 7-day average test positivity rate for Orange County in North Carolina.
These trends build upon underlying case incidence that was already high before students arrived. While we acknowledge that, in many places, a rise in cases this week may be a result of testing upon getting to campus, we won’t know the full impacts of how these increased case counts, and how universities respond to them, will translate to community disease burden for a couple more weeks. But it’s pretty clear that what happened in North Carolina was not simply testing on the way in the door.
At the K-12 level, we saw high schools pause reopening throughout the south (including many in Georgia) as they faced significant outbreaks, but fewer elementary schools close. Rhode Island also reported out that they saw very few outbreaks in daycares during a period over the summer in which their case incidence was lower than other areas of the nation. And in conversations with leaders in Philadelphia, it was reassuring to hear that they reported no outbreaks from the limited day camps and day programs they ran for younger children this summer. This type of evidence has built confidence for districts that choose to return younger children to the classroom first.
Where Our Projections Show Promise, and Raise Concern
Additionally this week, there were some other trends we projected in prior weeks that became clearer. For example, we suspected that we might see declining incidence in vacation destinations, and that is now clearly happening; many counties along the southeast and mid-Atlantic coastlines are improving from Virginia Beach to Rehoboth. Our projections also continue to suggest that the Midwest will not improve quickly, and transmission risk in the mid-Atlantic, though better, has stalled around the larger cities. Boston is a much less favorable position (as is Rhode Island) than it was a few weeks ago—the weekly case incidence in some areas there is approaching 90 cases per 100,000 individuals, which mirrors the Midwest.
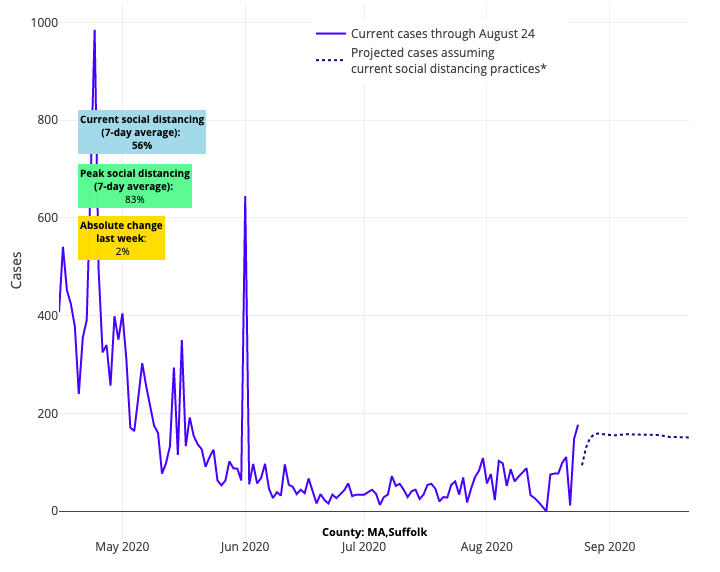
Above are the projections for Suffolk County in Boston.
Meanwhile, New York continues to be rock solid and stable, outperforming the rest of the Northeast, and northern New Jersey stabilized a bit, but we are still watching the Passaic region and southern areas of the state, including the shore. For all of the challenges that Portland and Seattle have had this summer, they have weathered the storm a bit, and end the month with nearly 50 cases per 100,000 individuals, not a bad place to be all things considered.
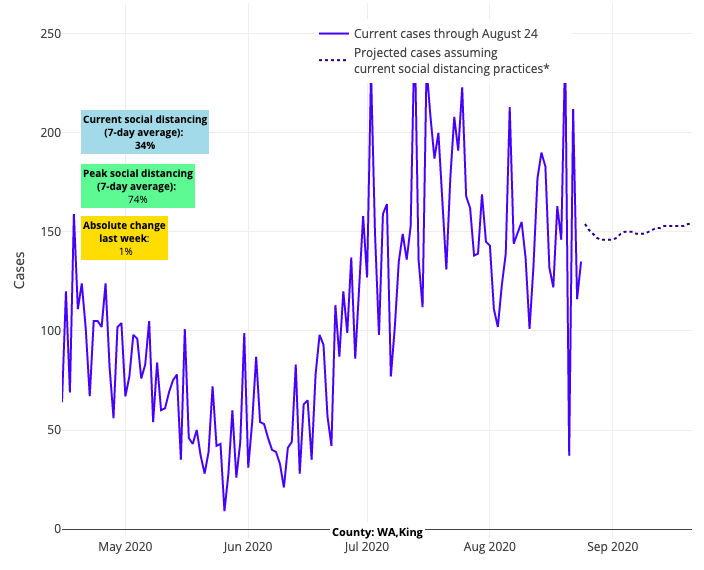
Above are the projections for King County in Washington.
Meanwhile, improvements in the Sun Belt and Southeast appear real, although projected case counts, though stable, are way too high in Tennessee, South Carolina, North Carolina and Georgia. We don't trust Texas data at the moment; there are too many counties with high testing positivity rates reporting an improving situation and lower rate of testing. That math doesn’t work; either they are not testing enough, or they are not reporting their tests. And in California, forecasts for counties in the south are improving slowly, save for Fresno, but the Sonoma/Napa/Chico/Sacramento region should be watched more closely. We presume that the precarious situation there is only being exacerbated by the devastating wildfires they are experiencing.
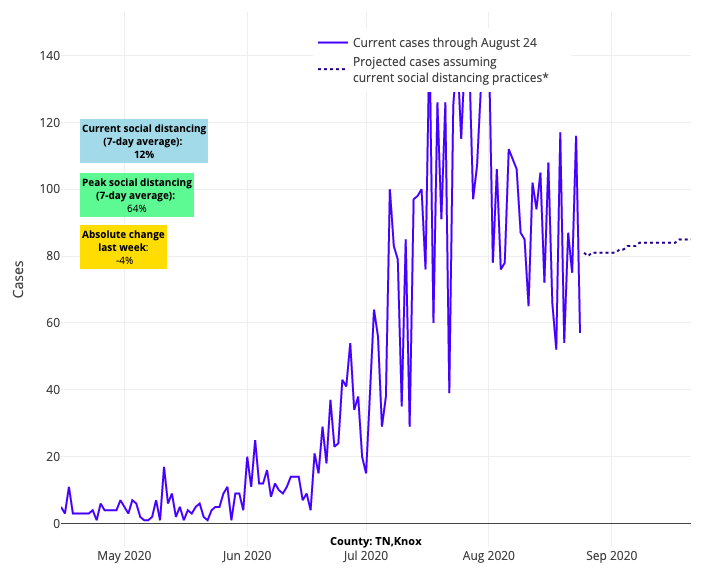
Above are the projections for Knox County in Tennessee.
Breaking Down the Reactions to Our School Reopening Guidance
Now, onto the questions that streamed in following last week’s release of PolicyLab’s updated school reopening guidance, which cautioned schools about the risk of reopening for in-school instruction before their declining weekly case incidence approached 10 cases per 100,000 residents. While less reported, the guidance also afforded many schools flexibility to provide in-school instruction to children with special education needs and those in elementary school if their weekly case incidence was declining and approaching 35 cases per 100,000 residents (assuming a low testing positivity rate below 5%).
We’ve heard from many families, school districts and public health experts as they prepared to incorporate our information into very challenging school reopening decisions for the fall. The most important takeaway from these conversations was to recognize that the thresholds we provided were particularly helpful for larger public school districts facing significant limitations with their facilities and access to testing, alongside tenuous discussions with teachers and principals who are appropriately concerned about preparedness. For them, having anchors by which to consider thresholds that might be considered safe has been helpful to try to solidify goals for reopening, and the needed steps to get there.
Many who have not yet achieved our recommended thresholds are seeing the wisdom of waiting out the first few weeks of September for mobility patterns to stabilize and college campuses to attempt to return to normal in their areas. If we are fortunate to see case incidence continue to decline, these larger districts will not regret those 3-4 weeks of patience; lower case incidence at opening will provide a longer runway for sustaining in-school instruction and firming up protocols before the colder weather returns.
But we also learned that these thresholds very much need to be considered in the context of individual schools or school systems. This was particularly true for private schools and districts in smaller communities.
For example, let’s say a smaller school or district with a measured weekly case incidence of 50 cases per 100,000 residents has an enrollment of only 1,000 students. Recognizing that the measured incidence is likely a fraction of all true positives (many kids are not tested), it would not be unreasonable to suspect that perhaps five students—maybe more, maybe less—and a staff member could test positive on day one. To arrive at that estimate, we multiplied the measured incidence by a factor of 10 to account for children, many asymptomatic, who would not be tested and would therefore not appear in public health reporting. This assumption marries to asymptomatic prevalence rates at different levels of community incidence that were reported from pre-procedural testing at some of our major children’s hospitals across the country in a new JAMA Pediatrics research letter just out yesterday.
For a private school with ample resources and space, or for even a smaller school district, a good safety plan—with daily symptom and exposure screens, masking and distancing throughout the day, and frequent hygiene and disinfection—should be more than sufficient to create a safe school environment. If schools like this are emboldened to reopen, we would understand and support that decision even if they have not quite hit our threshold.
But for larger public school systems, these choices are not as easy. Take Philadelphia for example, which has the same rate of 50 cases per 100,000 residents that we used in the last example. Using the calculus above, and with 200,000 enrolled students, they might expect more than 1,000 COVID-positive students on day one, alongside many COVID-positive teachers and staff members. For schools with limited flexibility with facilities and resources, this sheer volume could quickly overwhelm even the best safety plans, so the importance of the safety thresholds we provided are particularly acute for their decision-making.
So, ultimately, the message we are recalibrating this week is to interpret our safety guidance in the context of your own school system’s needs and preparedness. The thresholds are an important part of the decision, but one size does not fit all, and there are important nuances to weigh in defining the appropriate moment to bring students back to the classroom. And for those that reopen sooner, we will be following closely to incorporate into our guidance new data as it becomes available.
Gregory Tasian, MD, MSc, MSCE, is an associate professor of urology and epidemiology and a senior scholar in the Center for Clinical Epidemiology and Biostatistics at the University of Pennsylvania Perelman School of Medicine. He is also an attending pediatric urologist in the Division of Urology at Children's Hospital of Philadelphia.
