COVID-19 Outlook: Ringing the Alarm Bell for Epicenters, Waving the Caution Flag for Hotspots

It’s fair to say that as we enter summer, we now have conclusive evidence that hot weather will not be able to contain the spread of coronavirus without significant community buy-in to distancing and hygiene measures. From Arizona, to Texas, to the Carolinas, to Florida, we saw resurgence risk in last week’s projections that was far greater than just a couple of weeks prior, aided by regional spread as communities have reopened and transit has resumed.
This week, we have reached our highest level of alarm for the epicenters we’ve been following. As of today, Maricopa County, Ariz., is surpassing 2,000 cases a day, eclipsing the New York City boroughs even on their worst days. With the direst forecasts we have seen to date, alongside greatly elevated reproduction numbers and significant disease burden, it is fair to say that the state of Arizona has lost control of the epidemic. So too has Texas, where the Houston area surpassed 1,600 daily cases, and their children’s hospital began admitting adult patients. Florida is not far behind in our projections.
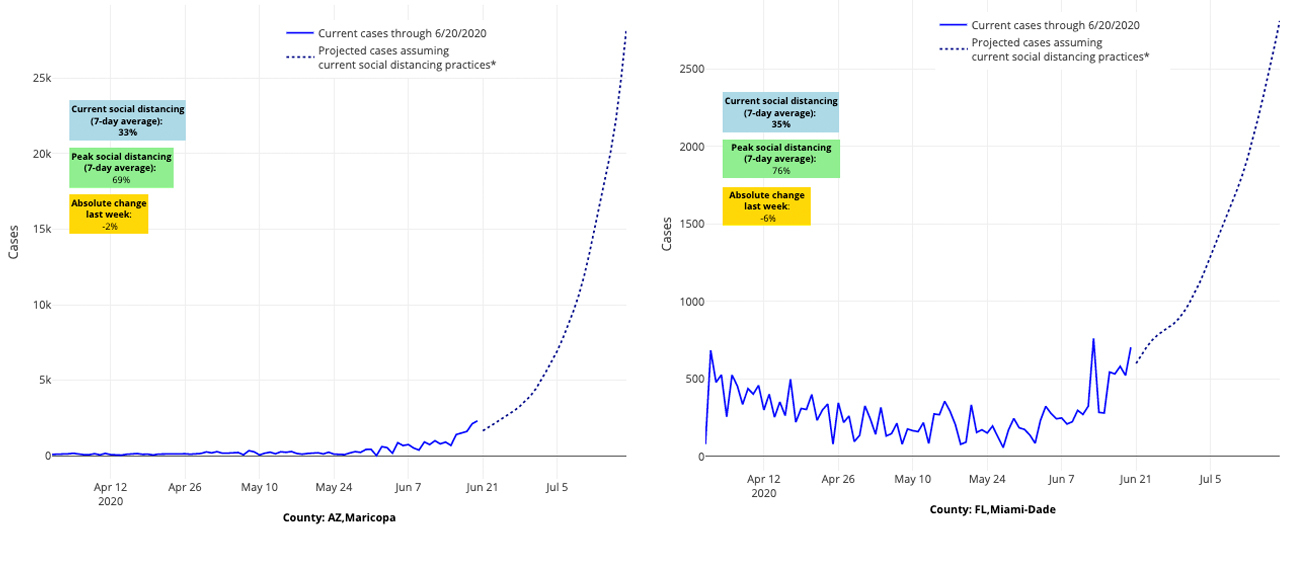
Above are the projections for Maricopa County in Arizona (left) and Miami-Dade County in Florida (right).
Even as cities in those locations try to catch up with universal masking laws and regulations, they may be too late to mitigate enough risk through masking alone. They may need to hit pause on their reopening, especially aspects that may be leading to unsafe crowding indoors. If this trend does not reverse very soon, more extensive mitigation strategies may be necessary to stem the tide. And for those watching in Las Vegas, Salt Lake City, Little Rock, Tulsa, and across South Carolina, we want to note that your worsening forecasts look eerily similar to those of the epicenters from just a few weeks ago. Now is the time to mount a strong response.
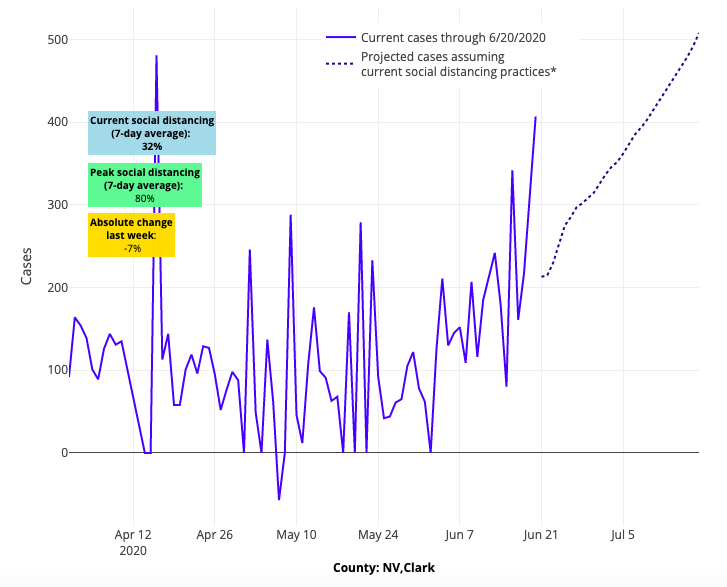
Above are the projections for Clark County in Nevada.
But it is also a time for reflecting on those communities that have taken the fight to this epidemic. We noted last week that Richmond, Va., had stopped the gathering storm traveling up I-95 from North Carolina, and we have seen the state continue to stabilize, nearly a month after their governor enacted a statewide requirement for masking in public locations. A large outbreak in the Yakima, Wa., region has been effectively contained, and we are seeing positive signs from Portland up to Seattle. California, with the exception of lingering issues in the Central Valley, may be finally turning the corner, assuming the widespread transmission in neighboring Arizona does not head their way and that people along the coast and up through Sacramento follow masking and distancing protocols. And finally, North Carolina’s COVID-19 case projections are starting to improve, suggesting new vigilance there is helping to avert the worsening forecasts in South Carolina and Florida to its south.
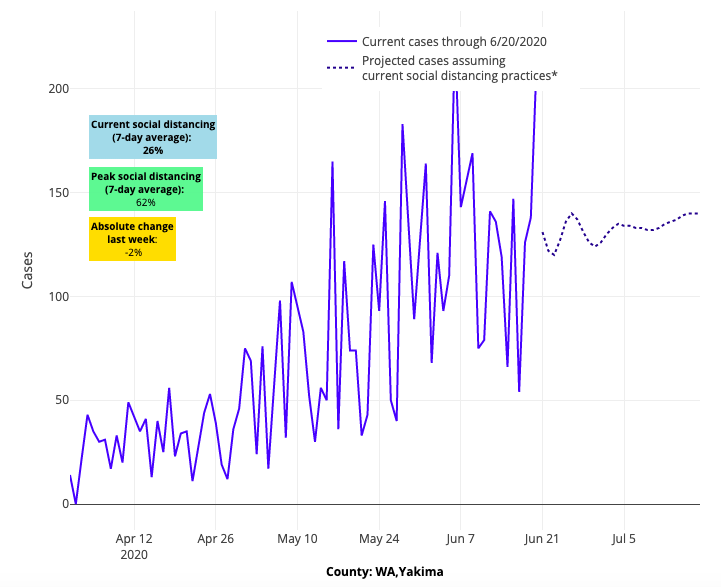
Above are the projections for Yakima County in Washington.
All of this is occurring as leaders throughout the country enact masking mandates. We can only hope this represents us reaching a tipping point in our collective response to the challenge in front of us.
With that, we wanted to take the opportunity to answer a couple of frequently asked questions we’ve been receiving about our models:
What do our forecasts mean for individuals and communities week to week?
First, we would caution against relying solely on a single forecast model. We do considerable work behind the scenes to validate our models by comparing the predictions from two weeks ago to actual observed cases. But there is some uncertainty as we rely on historical weather patterns for our predictions and cannot capture a community’s actual changing vigilance and on-the-ground response (e.g., we cannot not directly observe masking in public locations). Like a weather forecast, these forecasts are best viewed as snapshots over time. If each week, the forecast is increasing, there is more confidence that an area is experiencing a genuine surge in COVID-19. If neighboring counties also look worse, the concern is even greater for potential resurgence.
Week to week, our projections are also very sensitive to the amount of social distancing people are actually doing. Just a small tightening in vigilance can make a huge difference in the slope of next week’s forecasts. We saw this a couple of weeks ago in Richmond, Va., where we forecasted increased risk as we observed the epidemic spreading north along the I-95 corridor. The following week, we saw significant tightening in distancing within the Richmond area; accordingly, the resurgence did not occur and future forecasts stabilized, although at slightly higher daily levels of new coronavirus cases.
Our goal is to identify counties for which the situation appears ripe for a surge and inform the local community so they can practice extra vigilance in distancing and masking in order to flatten the curve. These forecasts provide an intervention opportunity to help ensure the uptick we predict does not occur.
That may mean making small changes to the amount of risk you take on a given week—taking extra precautions to avoid large indoor crowds, ensuring patrons wear masks when they enter your business and, perhaps, decreasing visits to restaurants or stores over the next couple of weeks. It’s also a signal to communities to ensure their locations at highest risk for local outbreaks, such as nursing homes, prisons and meatpacking facilities, are well-monitored.
In addition to the succession and regionality of weekly forecasts, there are other community indicators that can help you identify persistent, significant risk in your area:
- Looking at the test positivity rate, or the proportion of daily tests that are positive in your area. Test positivity rates often increase in the setting of widespread community transmission, as we have seen in Arizona, Texas and Florida. We actually incorporate test positivity rates into our models so that we don’t overestimate risk in counties that are doing a lot of testing as part of their contact tracing program.
- Watching daily new hospitalizations in your area. Unfortunately, the availability of hospitalization numbers has not been consistent across the country and we encourage public leaders in all states to start routinely reporting daily new hospitalizations, by county, as we head into the fall. Nevertheless, if you look hard enough, you can often find this information. Houston’s Texas Medical Center, for example, reports daily hospitalizations on their website. Since May 18, the 7-day average of daily new hospitalizations in Harris County has increased fourfold, from 46 to 186, and from June 11-21, they doubled from 90 to 186. Although this indicator is slightly delayed compared to new cases or to community symptom checklists (that may be used by schools or employers), it is unequivocal. If your hospitalizations are increasing, the risk in your area is increasing. Some states have noted many of their new cases are in younger people who have started socializing in public places again. While this population is less susceptible to severe illness from COVID-19 than older adults, and therefore less likely to require a hospital stay, they’re still at risk for spreading coronavirus to other medically vulnerable people in their communities when they go to the store, travel for summer vacation or if they work at places like restaurants. This risk grows even higher if they don’t wear masks in crowded indoor locations.
Using these additional metrics, our team is able to spot locations we need to learn from. Take San Diego, for example. Their overall cases have been rising slowly in recent weeks, and they certainly are surrounded by risk coming from Imperial, Palm Springs and San Bernardino, but their overall test positivity has been stable (excepting the last couple of days) and their hospitalizations continue to decline. This is a pattern that we seek to replicate in other locations.
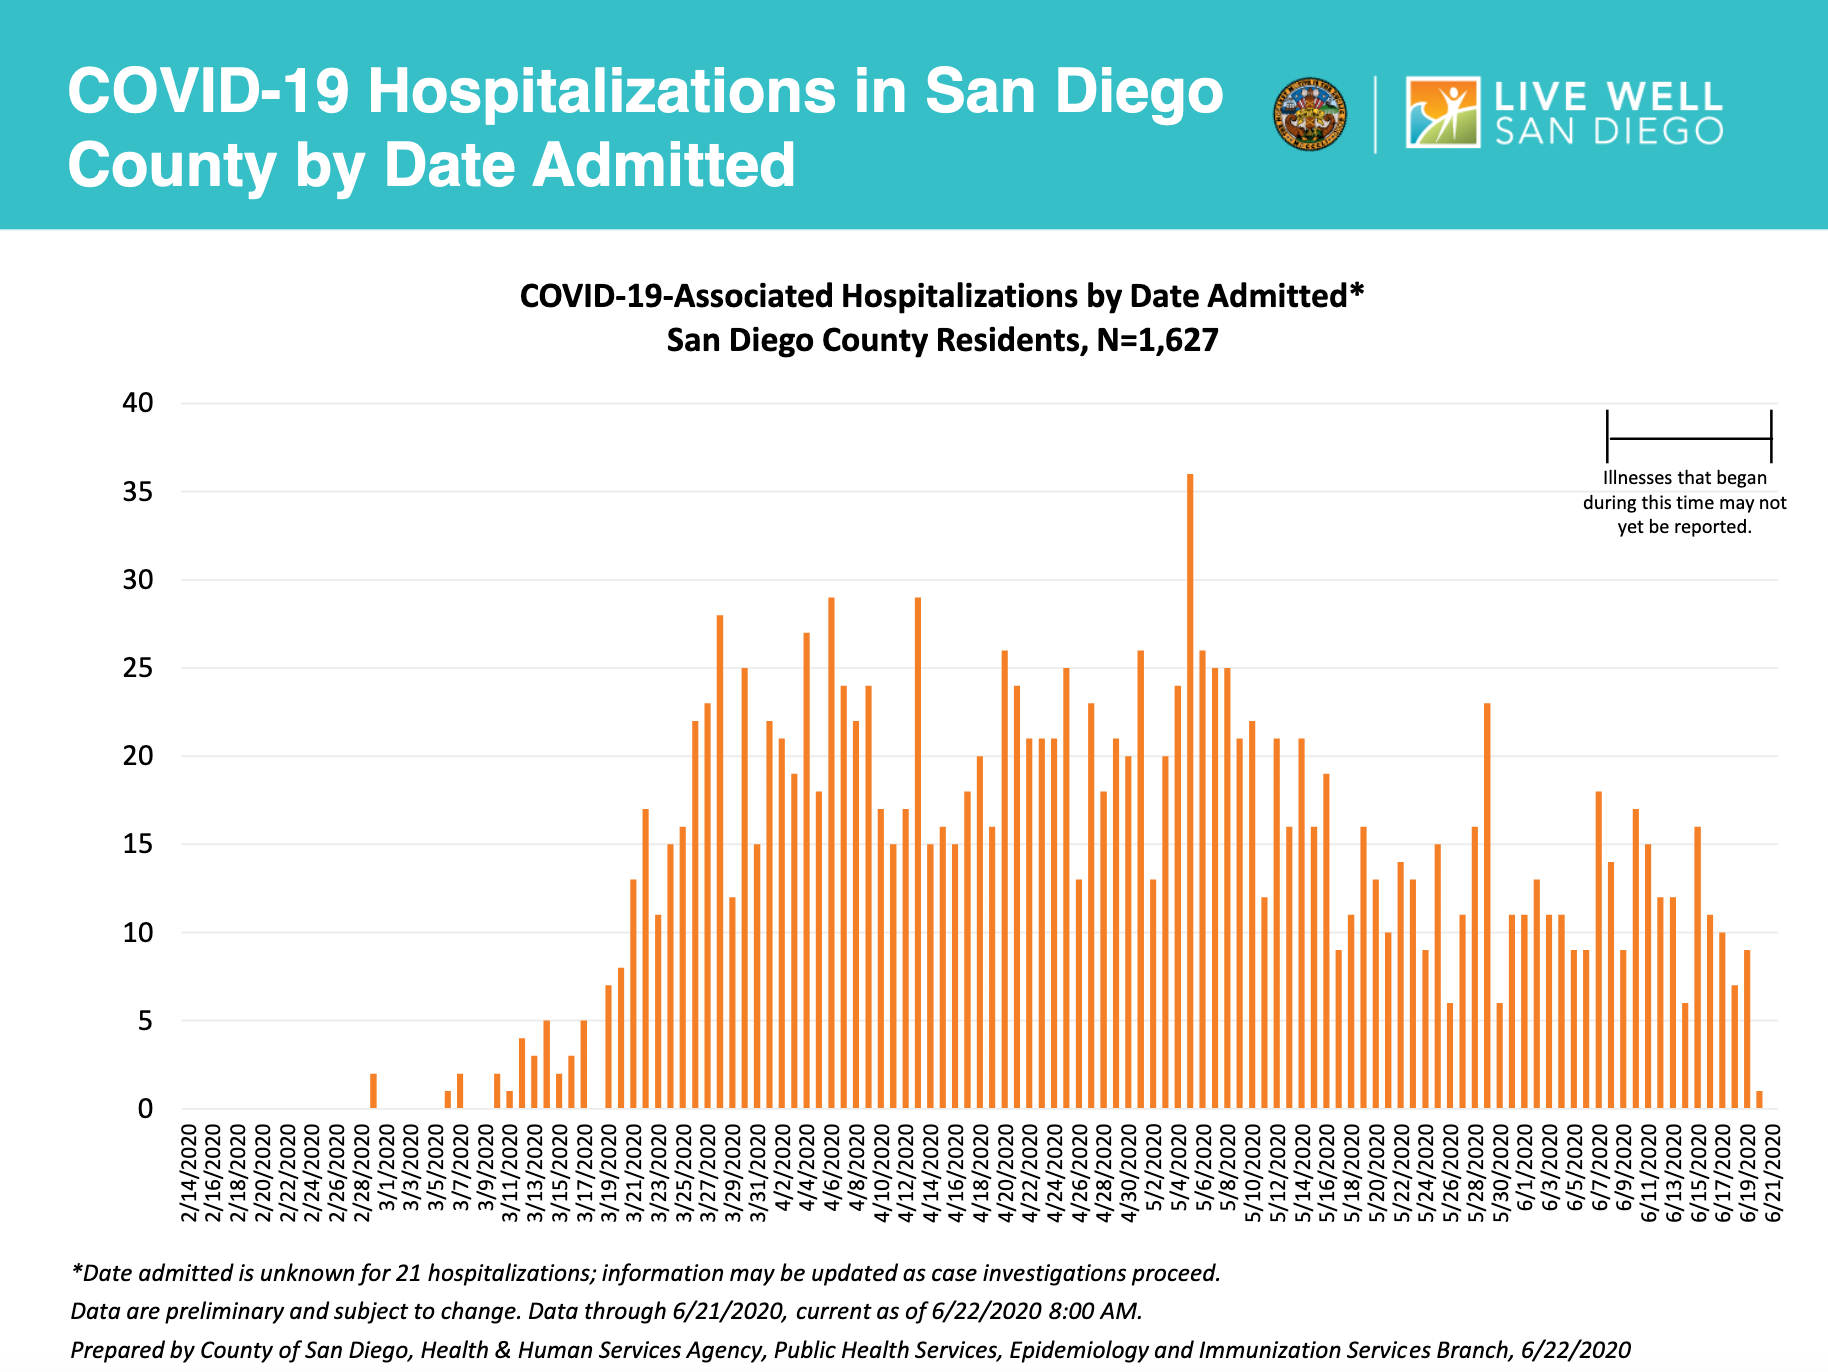
The data above was prepared by County of San Diego, Health & Human Services Agency, Public Health Services, Epidemiology and Immunizations Service Branch.
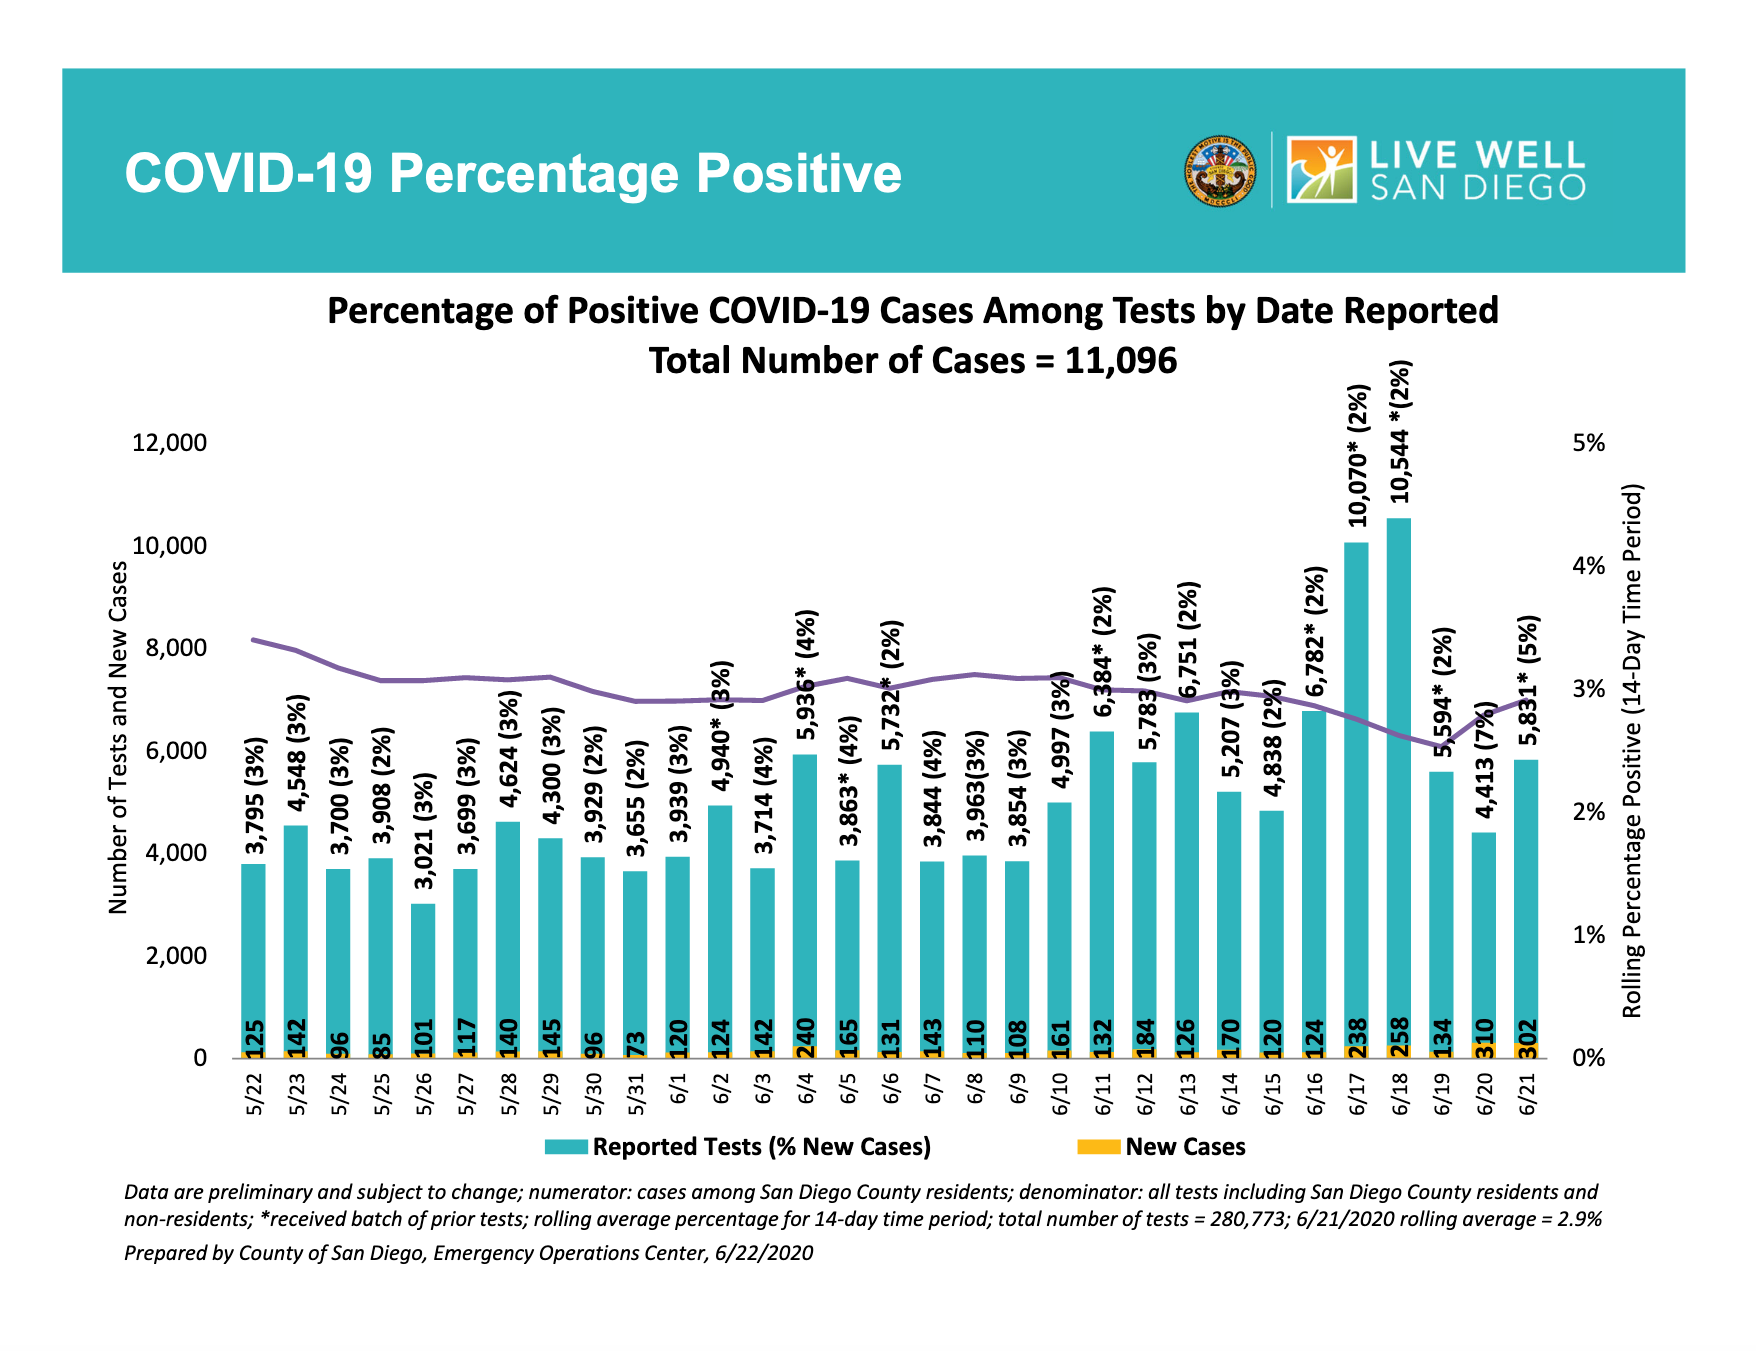
The data above was prepared by County of San Diego, Emergency Operations Center.
What about the falling COVID-19 fatality rate?
Recently people have pointed out that our country’s overall fatality rate is falling despite the recent new surge in infections. However, we would urge patience before reaching this conclusion as we would expect to see deaths increase about 3-4 weeks after infections start to rise. Therefore, it is unlikely that enough time has passed from the surge experienced in the South and Southwest for the corresponding deaths to manifest.
But, is it plausible that we won’t see a bump in deaths? The answer is cautiously yes.
- First, it is certainly possible that our health care systems are improving at treating disease; a recent preprint study suggesting benefit of dexamethasone offers some optimism that our doctors are figuring out how to modify the immune-mediated injury that occurs with this disease.
- Second, the potential shift in younger, more resilient individuals conferring a greater number of COVID-19 cases might reduce the death toll in the short-term, but as we noted above, is still a great cause for concern for continued community transmission. And we might expect a couple of weeks delay until older individuals are exposed from the younger people who are being infected in this wave.
- Third, it remains possible that the virus could become less virulent over time, but so far, we do not have data to support this.
- And finally, the most plausible hypothesis is that in summer, as high temperatures and humidity likely cause respiratory droplets to fall to the ground more quickly, the overall inoculum that infected patients receive could be lower, decreasing the severity of disease and risk of death. But respiratory transmission is likely to increase again in the fall with the return of colder temperatures. Without strict adherence to public requirements for mask wearing and a focus on hygiene, the inoculums are likely to be higher and the consequences more dire.
The Five C’s of COVID-19 Prevention
We leave you this week with some simple messaging our team has been working on to help communities hit reset and prioritize ways to control the spread of the disease and accommodate to the new normal in our lives until a vaccine is ready for public use:
The Five C’s of COVID-19 Prevention:
Control spread of disease by wearing masks in indoor locations or when unable to distance 6 feet
Clean your hands and environment, early and often
Company starts with small groups of friends and family before expanding slowly
Consider how you can easily reduce risk by small changes to your plans
Contain yourself at home when you or a family member is sick
Gregory Tasian, MD, MSc, MSCE, is an associate professor of urology and epidemiology and a senior scholar in the Center for Clinical Epidemiology and Biostatistics at the University of Pennsylvania Perelman School of Medicine. He is also an attending pediatric urologist in the Division of Urology at Children's Hospital of Philadelphia.
