COVID-19 Outlook: A Time to Follow the Data and Avoid Speculation
For the last few weeks, the epidemiological data have been telling a story of optimism—we are succeeding in slowing the spread of COVID-19, and have a fighting chance to bring this pandemic back under control. This week, we again see no signals of broad resurgence risk in the data generated from our COVID-Lab forecasting models. Here are the main findings from our weekly update:
- Testing positivity rates fell below 10% across the country last week—for the first time since the fall.
- Over the last two weeks, more than 90% of the 819 counties we follow in our models had a median reproduction number below 1, indicating declining transmission across the country.
- Nationally, daily hospital census for COVID-19 patients is now below 100,000 individuals, a 25% decline in just the last few weeks.
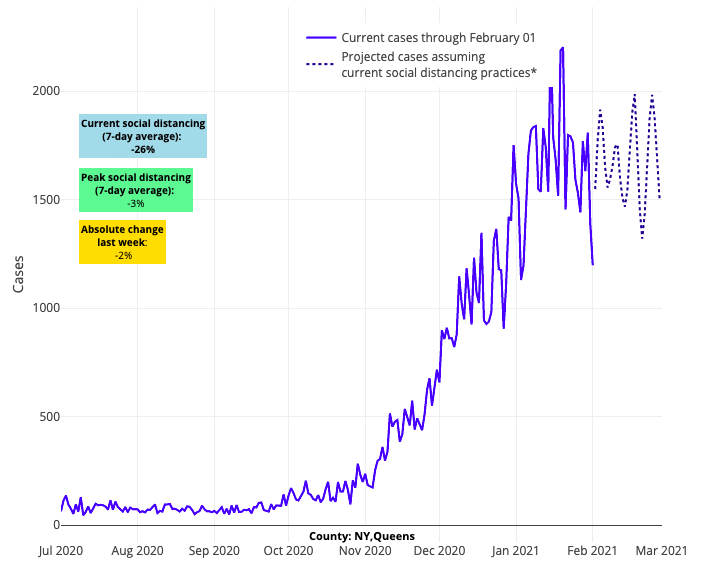
- Our models project continued high, but flat, case incidence in Queens and Brooklyn counties in New York, and a decline in transmission for the other New York City boroughs and surrounding metropolitan counties in New York and New Jersey. Additionally, New York state COVID ICU occupancy hovers near 30%, while daily hospital admissions dropped by one-third in the last week.

Above are the projections for Queens County in New York.
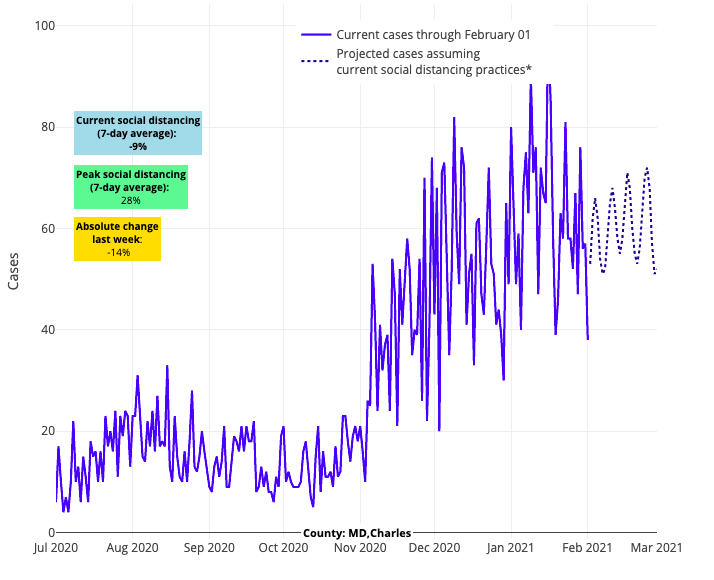
- While currently the Mid-Atlantic, and more specifically the region around the nation’s capital, continues to see elevated case incidence, testing positivity is declining in Maryland and Virginia and reproduction numbers are projected to fall below 1. These data suggest a period of sustained high transmission that will soon be followed by declines, similar to what we have seen this fall/winter in the Northeast and Midwest.

Above are the projections for Charles County in Maryland.
- In Florida, while emergency department visits remain high in many areas, hospitalizations are moving beyond their peaks. Based on declining test positivity rates, our models project a decline in transmission in the next few weeks, particularly in southern Florida.
- Our models project that major cities in both north and south Texas, including Dallas and Houston, are moving past peaks of case incidence and hospitalizations.
- California’s improving outlook is emblematic of major improvements along the Southwest corridor. While COVID-19 ICU occupancy is still high at 45%, daily reported fatalities and hospital admissions have dropped to half of what they were in early January. Los Angeles County continues to see about 500 weekly cases per 100,000 individuals, but this has come down from 1,000 weekly cases per 100,000 in early January.
- Despite all of these noted improvements, overall incidence in the U.S. still remains high with only one-quarter of the counties we follow falling below a daily case incidence of 200 weekly cases per 100,000 individuals.
How to Make Sense of the Risk Variants May Pose
We learned last week that in addition to the UK variant, other variants from South Africa and Brazil were detected on American soil. These variants are concerning as they have been associated with increased rates of transmission in the regions where they evolved. Furthermore, data from at least one vaccine trial suggested reduced efficacy of a vaccine in preventing infection in those regions. These data have prompted even more speculation that we may experience another large wave of COVID-19 infection in late winter or early spring.
While we remain concerned about the possibility for increased transmission of these variants within the U.S., we need to be careful not to become prisoners of speculation. Transmission of any variant of the SARS-CoV-2 virus has never been reliant on just the characteristics of the virus. Rather, transmission in any given region is dependent on many environmental and epidemiological factors, some of which may be in our favor.
For example, transmission will likely further decline in the spring as people are able to spend more time outdoors. Additionally, many highly dense areas have already experienced significant case burden during the pandemic. This high case incidence can deplete the number of potential susceptible individuals, which can break chains of transmission. We are also past the holiday season, when larger gatherings were responsible for spreading the virus. And finally, there are interventions and personal behaviors, like vaccine uptake and commitment to mask wearing and social distancing, which can help mitigate risk. From the start of the pandemic, it is these factors that epidemiologists (including our group) have found to be important predictors of resurgence risk, and which need be considered alongside a variant strain’s innate properties in order to understand potential transmission risk in future weeks.
A Helpful Guide to Viewing Our Models, Now with Hospitalization Data
As our team reviews our county-level models each week, we look across time and space to shape our forecasts. We have never simply relied on a single county’s forecast at a single moment of time because that narrow of a slice of data may be beset with uncertainty. We have encouraged those following our forecasts to note the week-to-week trends in our projections (e.g., the changing slope from week to week).
We’ve also found greater certainty when multiple adjacent counties are revealing the same trends over time. In fact, we’ve added a variable in the model, called a “metropolitan area random effect,” to capture the impact of disease trends in adjacent counties. We also carefully review a region’s COVID-19 test positivity rate, including the weekly rate and the difference from the prior week. Finally, we confirm our suspicions by reviewing hospitalization and mortality trends, which often lag behind infection data by a couple of weeks.
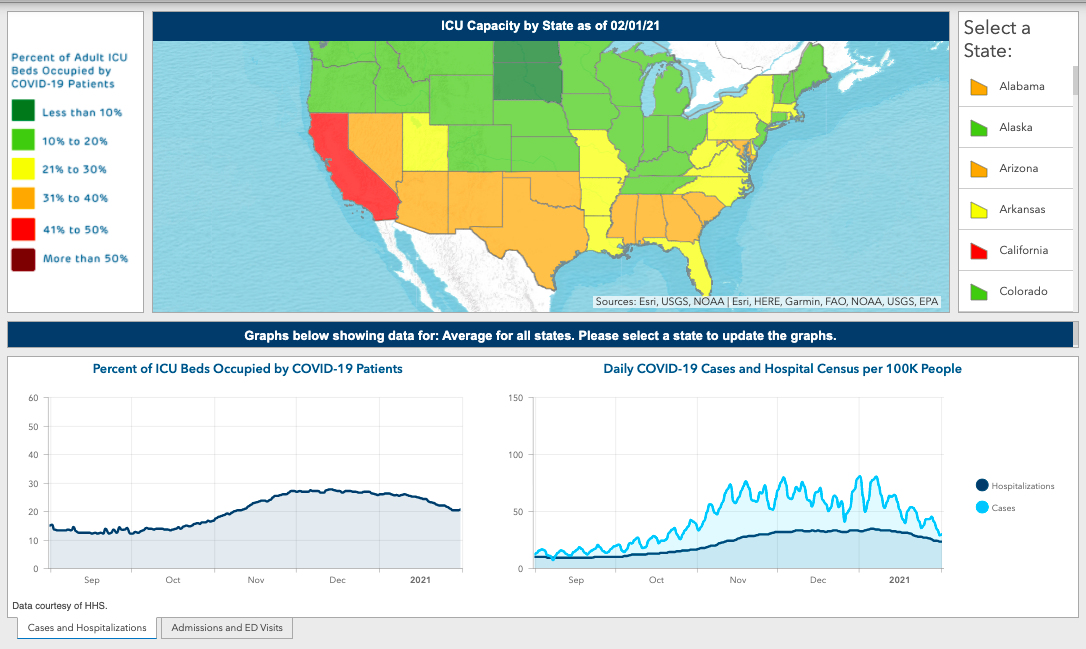
To help our readers see the full picture of the data we use to inform our analysis through these weekly blog posts, we added new visualizations on our website, courtesy of data from the U.S. Department of Health and Human Services and the Centers for Disease Control and Prevention. The new features include a national map that highlights state-level COVID-19 ICU occupancy (measured as a percent of ICU beds that are occupied daily by patients with COVID-19 infection), hospital daily census (measured as the total number of COVID-19 patients in the hospital), new daily COVID-19 admissions and daily COVID-19 emergency department visits.

As our readers review the new visualizations for their states, here are a few useful guiding notes and observations:
- The most sensitive indicators for significant case incidence increases in the coming weeks for any region has been the seven-day rolling average of positive PCR tests among all PCR tests conducted during that time period (termed the “PCR positivity rate,” which is already included in our main dashboard) and the number of emergency department visits over time. Similar indicators are tracked closely during influenza season.
- While many focus on our case incidence forecasts, our model actually predicts the instantaneous reproduction number (the transmission rate) for each county as a means to estimate future cases. We provide the forecasts for reproduction numbers each week, alongside our case incidence forecasts. When the reproduction number falls below 1, we know that there are some infected individuals who are not passing the infection to others, indicating that that region is likely to see decreasing cases. As noted above, over 90% of the counties we follow have had reproduction numbers below 1 for consecutive weeks. If “more contagious” strains begin to emerge in a region, we would expect to see the reproduction number rise first. An increase in the reproduction number back to 1.1-1.2 would be supporting evidence for resurgence. Fortunately, we have not yet seen this yet in our data, but it is something we will continue to monitor closely.
- COVID-19 ICU occupancy can detect when hospital capacity strain has become acute, usually at occupancy beyond 40% (i.e., 40% of ICU admissions are because of COVID-19). At those levels throughout the summer and fall, hospitals faced bed shortages for COVID-19 and non-COVID-19 patients alike.
- Daily hospital census can provide a more complete picture of COVID-19’s impacts across the U.S. than simply following the national death count. It may surprise some to learn that daily hospital census tracks closely with overall case incidence, not just in trend but in absolute value. This is because of all individuals identified with COVID-19 on a given day, only 10-15% are admitted to the hospital. Those individuals may spend, on average, 3-5 days in the hospital (and much longer for those with severe disease), creating a multiplicative effect that nears daily case incidence of all new cases when viewing daily hospital census. The sobering conclusion is that, to date, we have had 26 million individuals identified with COVID-19 infections in our country. We would predict that well over 3 to 4 million people have already been hospitalized, representing more than 1% of the entire U.S. population.
All told, our assessment of each of these data points over time tells us that we have moved past our winter surge.
This is good news, but is not a license to let down our guard. The looming potential of more transmissible variants threatens to revert our progress. Regardless of how these variants evolve in the U.S., the best way to avoid another resurgence is to continue to eliminate opportunity for transmission. First and foremost, we need to enhance vaccination delivery across the country and encourage those who are hesitant to recognize that vaccination is truly our best tool for stopping this pandemic. As vaccine roll out improves, we need to simultaneously create easier access to frequent testing so as to speed identification of contagious individuals and isolate them quickly. And individually, we need to redouble our commitments to wear our masks to protect each other, and keep our gatherings small, until we are confident that the worst of this tragedy is behind us.
